spx (80)

Admin

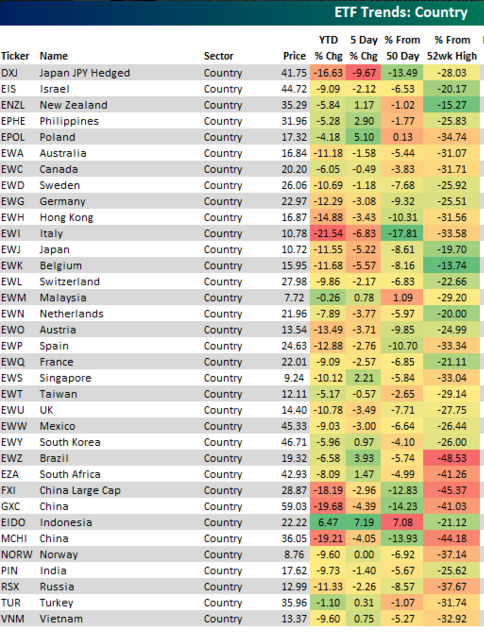
The stock market continues to weaken, as evidenced by these ETF charts.    If you zero in on a sector you wish to short, I would bear in mind that ETFs are comprised of market leaders.  I would look for names "outside" of the ETF components; consider them leaders and you want the weaklings to short.

The reasons for weakness are numerous. 

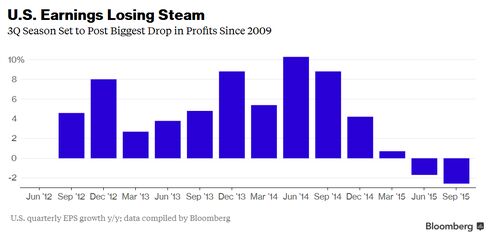
Consider the election weight (a Trump win would weigh on equities but Clinton weighs on pharma pricing).  Then there are flat-to-dropping sales.  Of course the USD movement (up will weigh on commodities and large caps with overseas exposure).  Then there's those who feel we are already at or above maximum value and they're not buying here.  They're hedged, short some and long financials ahead of the Fed rate hike.  Then there's that Fed hike itself.  High dividend is flushing down the toilet (SDY) in September.  Overseas weakness with China not helping boost confidence for demand.  And we also have more failure at the OPEC talks with no offer from o

Read More, Comment and Share......

Admin

Tactically Cautious On Global Equities

A December Fed rate hike, uncertainty regarding the U.S. presidential elections, weak earnings growth, diminished buyback activity and concerns about European banks pose near-term risks to global equities.  Comments in italics are mine.

DIN-20161011-091957

The summer rally has left equity valuations looking stretched. The median U.S. stock now trades at a higher P/E ratio than even at the 2000 peak. The Shiller P/E ratio stands at 27, but would be 37 if profit margins over the preceding ten years had been what they were in the 1990s. The fact that interest rates are low gives stocks some support, but with the Fed likely to hike rates in December, that tailwind will begin to fade.

Lackluster earnings growth remains another concern. S&P 500 and economy-wide profit margins have rolled over. Granted, the collapse in profits in the energy sector has been the major culprit, and this headwind should wane if oil prices edge higher over the next 12 months, as we expect. Nevertheless, faster wage growth and a f

Read More, Comment and Share......

Admin

Buyers Stay Home; See You Next Fall

markets.png?width=750

(Click image to enlarge)

There's nothing here that even remotely makes me want to make a purchase. These are weekly shots of the main indexes so what do you see?

We rallied up over weeks like crazy madmen, squeezing out weak shorts and even had the heaviest shorted sectors help out with a short covering rally; getting the weekly into 'overbought' levels. We came up right against the long term column trend line resistance, hit overbought levels...........the weekly is rolling over. Another failure. Sorry boys. So much for that.

Certainly day traders and short-term swing traders will make their long plays but who has time for that............and why go against the trend of 'this' market......which is down. That's rhetorical.

  • We know the market is stretched on a valuation basis.
  • Don't even throw out the strange valuation approaches.
  • We know there's no more QE coming out of Washington.
  • We know earnings are a disappointment and guidance has for the most part been completely uninspiring.
  • T

Read More, Comment and Share......

Admin

The Global Economy: April 2016

The global economy has regained some composure, according to asset management firm Schroders. In their view, markets have regained a risk appetite following action by central banks, the normalization of commodity prices, and a lack of materialization for tail risks such as a U.S. recession or a Chinese hard-landing:

economic-infographic-apr-2016.jpg

While volatility is indeed near its YTD low with the benchmark VIX down 32% since the start of the year, we would point out that this is potentially some calm before the storm.

Here are some upcoming waves, and we’ll see how they break:

Earnings and Buybacks: The blended earnings decline for the S&P 500 so far in 2016 Q1 is -8.9%, according to Factset. When earnings season is done and if this stays on target, it will mark the first time the index has seen four consecutive quarters of year-over-year declines in earnings since Q4 2008 through Q3 2009. That said, companies are doing whatever they can to stifle these declines via share buybacks. S&P Dow Jones says that nearly

Read More, Comment and Share......

Admin

Understanding Market Structure

While there's been so much 'worrying' over the slowdown in China, the Fed possibly raising rates and energy defaults with the weight on banks, it's still a good idea to remember a stock markets structure; or the steps it takes before a bear market takes place.  The basic strategy is to pay close attention during the accumulation and distribution phases as the market shifts from buyers to sellers, or vice versa. Then, by recognizing the markup and decline phases, an investor can be appropriately long or short to make solid returns.  Click image to enlarge.

1291363?profile=RESIZE_1024x1024

Courtesy of the good folks at VisualCapitalist

Read More, Comment and Share......

Admin

The Bloomberg US Financial Conditions Index and the S&P 500 tend to move in pretty close unison. In March, however, they started to move apart in a manner similar to late last year, before the market took a nosedive. Once again, either financial conditions improve or the stock market corrects.

bloomberg financial conditions spx
Source: Bloomberg

Shown below we see a similar wide divergence when looking at credit spreads (inverted in red) compared to the S&P 500 (in black). When financial conditions are healthy, credit spreads narrow since investors require less compensation for the risk of holding non-government securities. As financial conditions deteriorate and default risks increase, credit spreads widen. The credit markets were confirming the message of the stock market up until mid-2014 and have continued to diverge ever since. Either credit spreads narrow or the stock market adjusts.

BBB spread spx
Source: FinancialSense

Read More, Comment and Share......

Admin

1291314?profile=RESIZE_480x480

Another one that says what could cause a collapse; of course they never say "when" it will happen.  Another reason to remain cautious and take winners where you can.

According to CNBC, the S&P 500 is close to its record high as earnings season heats up, but one of the major drivers of the market's advance - stock buybacks - looks to be sagging.

U.S. companies announced about $182 billion in buybacks in the first quarter, according to Birinyi Associates research, putting buybacks on pace for their weakest year since 2012. Strategists link this, in part, to falling cash flow, a trend that is expected to worsen in coming quarters.

First-quarter earnings per share are expected to fall 7.8 percent, but more importantly for the outlook for buybacks, revenues are set for a fifth consecutive quarter of decline. Thomson Reuters data forecasts a 1.1 percent revenue drop.

Cash flow is a better indicator of buybacks prospects than earnings, as per-share earnings can be managed through cost-c

Read More, Comment and Share......

Admin

Stock-Market-Bubble.jpg?zoom=1.5&fit=800%2C540&ssl=1&width=600

Of course, no where does it say how long this can continue but it's important to be aware. No, it can't go on forever.

We are now entering earnings season once again. Pre-announcements have been the second-worst seen over the past decade.1291333?profile=RESIZE_1024x1024

This has analysts lowering estimates. In fact, they’ve been lowered so far quarterly earnings now look to fall all the way back to 2009 levels.

1291379?profile=RESIZE_1024x1024

For the trailing twelve months earnings are now back to 2011 levels…

1291409?profile=original

…even while stocks remain 75% above their own levels from back then. Taken together you get a price-to-earnings ratio of 24, higher than any other time over the past several years.

1291487?profile=RESIZE_1024x1024

It should go without saying that extreme valuations and falling earnings are not a bullish recipe for stocks.

1291568?profile=RESIZE_1024x1024

So the fundamentals are not supportive of higher prices. What then has been driving them higher in recent weeks?

1291578?profile=original

And the greater fools are none other than the companies themselves…

1291590?profile=original

…for now. If earnings don’t turn around soon (and corp

Read More, Comment and Share......

Admin

Debt Doesn't Go On Forever

1291294?profile=RESIZE_480x480NYSE margin debt fell again during the month of February. After the selloff in stocks that kicked off 2016, this should come as no surprise. Investors are usually forced to reduce leveraged bets during these sorts of episodes in the stock market. In fact, this forced selling can actually exacerbate the volatility. And because margin debt is only now beginning to come down from record highs, surpassing those seen at the 2000 and 2007 peak, this should be of concern to most equity investors.

To fully appreciate this risk, I prefer to look at margin debt relative to overall economic activity. When leveraged financial speculation becomes large relative to the economy, it’s usually a sign investors have become far too greedy. As Warren Buffett would say, this is usually a good time to become more fearful, or conservative towards the stock market.

Not only did margin debt recently hit nominal record-highs, it hit new record-highs in relation to GDP, as well. In other words, over the past s

Read More, Comment and Share......

Admin

Why Most People Fail At Trading

One item I completely agree with is the pundits and "know it alls" on entertainment news television.  They're there to entertain you; not make you rich.  I get my economic releases on them and *off* they go the rest of the day.  I trust my charts; charts don't lie.  People do.

1291386?profile=RESIZE_1024x1024Courtesy of Martinkronicle

Read More, Comment and Share......

Admin

When Stocks Are On Sale

This caught my eye as I tend to look at stocks when they near a significant, long-term support such as a 100 month or 200 month EMA or SMA.  Of course I'm buying with a long term perspective in this approach but it got me wondering: Is is better to hold your breath and simply buy stocks when they've sold off 20%? The downside still terrifies me but looking at historical returns is intriguing.   From Awelathofcommonsense:

Large cap U.S. equities continue to hold up well with the S&P 500 down roughly 12% from its all-time highs reached last spring. To some degree, this performance has masked the global bear market going on in the rest of the world. Take a look at this list of country ETFs from Bespoke Investment Group:


Screen Shot 2016-02-10 at 10.21.57 AM

The average drop from the 52-week high on this list is just shy of 30%. Not too pretty. But beauty is in the eye of the beholder in these situations. Historically, buying global stocks after they have fallen into bear market territory has been rewarding for investors.

I

Read More, Comment and Share......

Admin

Where Money's Been Flowing

When first-generation ETFs launched in the 1990s—such as the SPDR S&P 500 Trust (SPY) and the PowerShares QQQ Trust Series 1 (QQQ)—lead this year's outflows, that is a sign that institutional investors are scared. These first-to-market ETFs have the ample liquidity that big institutions tend to love, with many trading more than $500 million in volume a day. While newer ETFs that may do the same thing or more for cheaper have been launched in the intervening years, early ETFs still tend to curry favor with large investors that value liquidity. These investors tend to be more tactical, and thus outflows from these ETF stalwarts are a bearish sign. 

488x-1.jpg
Photographer: Balchunas, Eric

U.S. Treasuries of all maturities are raking in cash

According to Bloomberg, when U.S. Treasury ETFs are the brightest bright spot, that's not good. They have taken in more than $3 billion in net new cash (while junk bond ETFs have seen $2 billion in outflows). What is especially bearish is that the inflows int

Read More, Comment and Share......

Admin

Bear Market? Yes It Is

The latest market selloff can be blamed on any number of things.  China slowdown or a possible hard landing in China, basic profit taking after a six-year run, declining earnings, no further QE in the US, a uptick in rates in the US, weak US economy, commodity (including crude oil) collapse, weakening of 'risk' currencies due to the commodity selloff, disappearance of buybacks, dividends being lowered, strong US dollar pressuring balance sheets, bear markets in pc sales, rail fees,.........the list goes on and on.  Bottom line: we need something solid to rally on and I fear any earnings pops will be given back.  Netflix will be a good example tomorrow after the close.  We simply cannot justify going higher without a catalyst.

The Wall Street Journal reminds us that this is not 2008 redux but just 'where' we bottom is open to speculation.  So I'll just sit back with my hedges and wait it out.  Here I'll note a few things I haven't seen plastered across the internet. 

Although the mont

Read More, Comment and Share......

Admin

Recession Proponents Watching Yield Curve

Is our economic recovery truly as strong as charts would imply?  Are we strong enough to stand on our own at these levels, or have we overshot the boundaries thanks to quantitative easing?  Are economics in the U.S. strong enough or does recession lie ahead?

Curve watchers Anonymous has an eye on the yield curve. Here is a snapshot of year-end-closing values from 1998-12-31 through 2015-12-31.

Yield Curve Year End Closing Values 1998-2015

yield%2Bcurve%2B2015-12-31.png

Unlike 1999-2000 and again 2007-2007, no portions of the yield curve are inverted today (shorter-term rates higher than longer-term rates).

Inversion is the traditional harbinger of recessions, but with the low end of the curve still very close to zero despite the first Fed hike, inversions are unlikely.

Yield Curve Differentials: 3-Month to Longer Durations
yield%2Bcurve%2B2015-12-31A.png


Yield Curve Differentials: 1-year to Longer Durations
yield%2Bcurve%2B2015-12-31B.png
Yield Curve Differentials: 2-year to Longer Durations

yield%2Bcurve%2B2015-12-31C.png

In general, albeit with some volatility, the yield curve has been flatteni

Read More, Comment and Share......

Admin

Negative Growth. Thank You Deflation And QE

?m=02&d=20151113&t=2&i=1094697813&w=644&fh=&fw=&ll=&pl=&sq=&r=LYNXNPEBAC140&width=300Investors may wade into unknown territory next month as the Federal Reserve readies the first rate hike in nearly a decade amid a corporate earnings recession.

S&P 500 earnings are on track to close their first reporting season of negative growth since the Great Recession and estimates call for sub-zero growth in the current quarter as well.

Even if the trend reverses next year, as expected, a Fed rate hike in December could mark an unprecedented conflict between a tightening cycle starting at the same time as earnings fall into recession.

"We can't think of any instances when the Fed was hiking during an (earnings) recession," said Joseph Zidle, portfolio strategist at Richard Bernstein Advisors in New York.

"In the last six months one can point at a lot of different things. But if you think about fundamentals, falling corporate profits and the threat of rising rates" are behind the market stalling, Zidle said.

With more than 90 percent of S&P 500 components having reported, S&P 500 e

Read More, Comment and Share......

Admin

3Q Earnings Worst Since 2009

This U.S. earnings season is on track to be the worst since 2009 as profits from oil & gas and commodity-related companies plummet leaving many to wonder, is the worst behind us or is there more to come?  Is China's growth story over or taking a 'rest'?  We've lived on ghost cities creating demand for so many years; where is the next growth story?

So far, about three-quarters of the S&P 500 have reported results, with profits down 3.1 percent on a share-weighted basis, data compiled by Bloomberg shows. This would be the biggest quarterly drop in earnings since the third quarter 2009, and the second straight quarter of profit declines. Earnings growth turned negative for the first time in six years in the second quarter this year.

488x-1.png

The damage is the biggest in commodity-related industries, with the energy sector showing a 54 percent drop in quarterly earnings per share so far in the quarter, with profits in the materials sector falling 15 percent.

The picture is brighter for the telec

Read More, Comment and Share......

Admin

And They Crawl Out Of The Woodwork

1291256?profile=RESIZE_320x320You know it's coming and it won't be any easier to take than when you were small and your Mother said "I told you so".  The blogisphere will now erupt with the force of an annoying snaggle tooth emphatically screaming "I warned you" and "I said it was coming.........now buy my plan so you're prepared"  and ca-ching, you cough up the coin like a kid at the carnival freak show.   Every smidiot and hack will now attack your inbox on how they could have prevented your losses and how (via in their premier plan) you would have benefited this week.......if you had only listened.

Puhlease

Markets correct.  On occasion, they correct more than mere pullbacks but the essential thing to remember is, they recover.  

No, it's not a master plot against Donald Trump.  His over-swept hair is safe and........seriously?  Who would even dream up that scenario (smh) but the heavy-selling picture last week certainly backed up a Dow sell-signal and have many wondering, just where we'll stop or is the bu

Read More, Comment and Share......

We welcome you to post a blog entry, oped or share your daily reading with us as long as it is relevant to the topic of investing and not an attempt to sell a product, proprietary strategy, platform or other service. Please provide links to any research data and if re-posting other articles, give credit where credit is due providing a back link to the original site.

300 words minimum per post. You may also sort by category or search by topic. Don't forget to comment and please "share" via Facebook, Twitter and Google+. If you have any questions, please contact us.

FOLLOW STOCKBUZ

__________________

This is a member-supported site. Please donate when you can to help pay the rent. Thank you!

Stay Informed. Sign up for the FREE StockBuz eNewsletter

________________

Investing involves substantial risk. All content is subject to StockBuz disclaimer.

Create Income With Option Spreads

All content on StockBuz.net is subject to disclaimer and Terms of Service