returns (2)

Admin

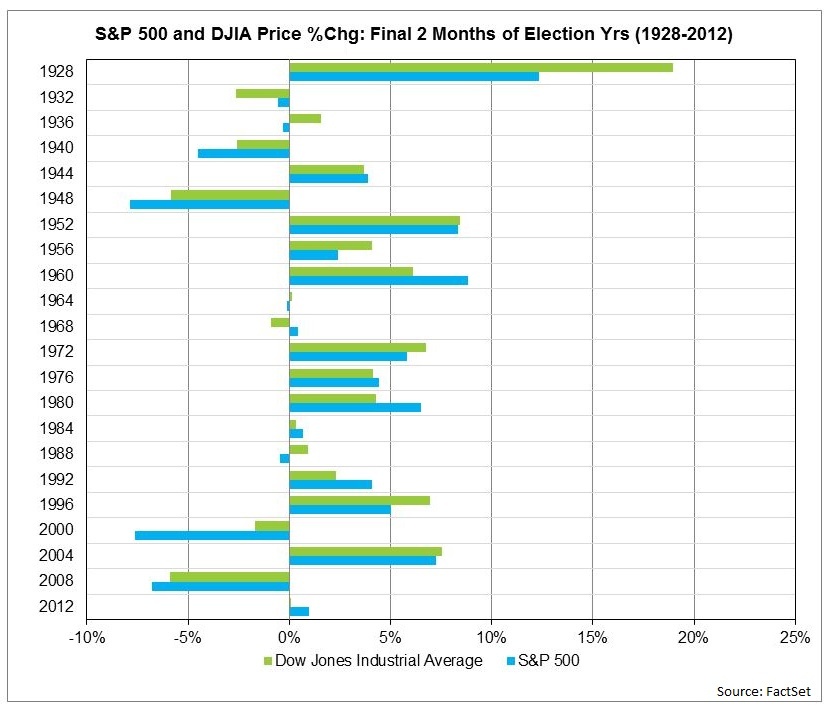
Election Day in the United States is, at last, almost here. Similar to any other major event, investors will be looking to what effect the presidential election will have on the stock market for the rest of the year and beyond. One way we can predict this movement is to analyze the historical price performance of the S&P 500 and the Dow Jones Industrial Average during past election cycles. Here we'll examine:

  • How does the stock market perform in the final two months of presidential election years?
  • What effect does the elected political party have on stock market performance in the years following the election?
  • Which sectors are the top performers during election years and post-election?

1%29%20S&P500%20DJIA%20Prive%20Change%20Final%20Two%20Months%20of%20Election%20Years.jpg?t=1478268643387&width=1024&name=1%29%20S&P500%20DJIA%20Prive%20Change%20Final%20Two%20Months%20of%20Election%20Years.jpg

S&P 500 and Dow Jones Industrial Average Underperform during Election Years

During presidential election years going back to 1928, the S&P 500 index has been in the positive 73% of the time (16 out of 22 years). The average price gain of the S&P 500 during election years was 7%, which trailed the 7.

Read More, Comment and Share......

Admin

When Stocks Are On Sale

This caught my eye as I tend to look at stocks when they near a significant, long-term support such as a 100 month or 200 month EMA or SMA.  Of course I'm buying with a long term perspective in this approach but it got me wondering: Is is better to hold your breath and simply buy stocks when they've sold off 20%? The downside still terrifies me but looking at historical returns is intriguing.   From Awelathofcommonsense:

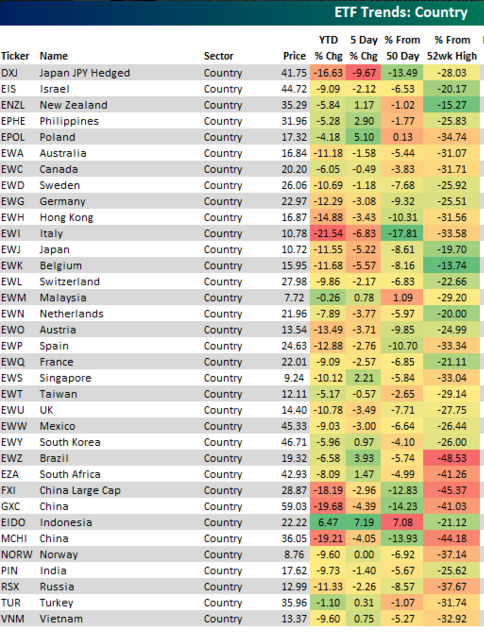
Large cap U.S. equities continue to hold up well with the S&P 500 down roughly 12% from its all-time highs reached last spring. To some degree, this performance has masked the global bear market going on in the rest of the world. Take a look at this list of country ETFs from Bespoke Investment Group:


Screen Shot 2016-02-10 at 10.21.57 AM

The average drop from the 52-week high on this list is just shy of 30%. Not too pretty. But beauty is in the eye of the beholder in these situations. Historically, buying global stocks after they have fallen into bear market territory has been rewarding for investors.

I

Read More, Comment and Share......

We welcome you to post a blog entry, oped or share your daily reading with us as long as it is relevant to the topic of investing and not an attempt to sell a product, proprietary strategy, platform or other service. Please provide links to any research data and if re-posting other articles, give credit where credit is due providing a back link to the original site.

300 words minimum per post. You may also sort by category or search by topic. Don't forget to comment and please "share" via Facebook, Twitter and Google+. If you have any questions, please contact us.

FOLLOW STOCKBUZ

__________________

This is a member-supported site. Please donate when you can to help pay the rent. Thank you!

Stay Informed. Sign up for the FREE StockBuz eNewsletter

________________

Investing involves substantial risk. All content is subject to StockBuz disclaimer.

Create Income With Option Spreads

All content on StockBuz.net is subject to disclaimer and Terms of Service