bear market (8)

Admin

Bull Case Thwarted By Bumpy Landing

10972951660?profile=RESIZE_180x180Wall Street’s reaction to hotter-than-estimated inflation data suggested growing bets the Federal Reserve has a long ways to go in its aggressive tightening crusade, making the odds of a soft landing look slimmer.

After a lengthy period of subdued equity swings, volatility has been gaining traction. That doesn’t bode well for a market that’s gotten more expensive after an exuberant rally from its October lows. Stock gains have been dwindling by the day amid fears that a recession in the world’s largest economy could further hamper the prospects for Corporate America.

A slide in the S&P 500 Friday added to its worst weekly selloff since early December. The tech-heavy Nasdaq 100 tumbled about 2% as the Treasury two-year yield topped 4.8%, the highest since 2007. The dollar climbed. Swaps are now pricing in 25 basis-point hikes at the Fed’s next three meetings, and bets on the peak rate rose to about 5.4% by July. The benchmark sits in a 4.5%-4.75% range.

“There’s little room for upside i

Read More, Comment and Share......

Admin

Debt Doesn't Go On Forever

1291294?profile=RESIZE_480x480NYSE margin debt fell again during the month of February. After the selloff in stocks that kicked off 2016, this should come as no surprise. Investors are usually forced to reduce leveraged bets during these sorts of episodes in the stock market. In fact, this forced selling can actually exacerbate the volatility. And because margin debt is only now beginning to come down from record highs, surpassing those seen at the 2000 and 2007 peak, this should be of concern to most equity investors.

To fully appreciate this risk, I prefer to look at margin debt relative to overall economic activity. When leveraged financial speculation becomes large relative to the economy, it’s usually a sign investors have become far too greedy. As Warren Buffett would say, this is usually a good time to become more fearful, or conservative towards the stock market.

Not only did margin debt recently hit nominal record-highs, it hit new record-highs in relation to GDP, as well. In other words, over the past s

Read More, Comment and Share......

Admin

Bear Market? Yes It Is

The latest market selloff can be blamed on any number of things.  China slowdown or a possible hard landing in China, basic profit taking after a six-year run, declining earnings, no further QE in the US, a uptick in rates in the US, weak US economy, commodity (including crude oil) collapse, weakening of 'risk' currencies due to the commodity selloff, disappearance of buybacks, dividends being lowered, strong US dollar pressuring balance sheets, bear markets in pc sales, rail fees,.........the list goes on and on.  Bottom line: we need something solid to rally on and I fear any earnings pops will be given back.  Netflix will be a good example tomorrow after the close.  We simply cannot justify going higher without a catalyst.

The Wall Street Journal reminds us that this is not 2008 redux but just 'where' we bottom is open to speculation.  So I'll just sit back with my hedges and wait it out.  Here I'll note a few things I haven't seen plastered across the internet. 

Although the mont

Read More, Comment and Share......

Admin

Chart Palooza

I'm continually saving charts and data points which I find interesting but generally don't post enough to share the data.  That being said, I thought "wth" and decided to share some of my most recent.  Perhaps you can find a few of interest or maybe you can translate one into a trade.  It certainly can't hurt.  Your comments would be of interest and will be answered.  Happy trading.

Online shoppers by income group.  It certainly seems Amazon benefits by middle income buyers.  Possibly they just don't have the 'time' to shop in a store, working 60+ hours a week and balancing soccer games, football, cheerleading practice, dinner, laundry, etc.

1291227?profile=original

Jet[dot]com is now selling some items at a loss to gain marketshare from Amazon

1291267?profile=RESIZE_480x480

We've had numerous talks in Chat over coal usage (is clean coal an oxymoron or what?) and this certainly backs up the belief that natural gas continues to be embraced.

1291300?profile=original

Then we have a look at Bear markets of 20% or more.The average # of months caught my eye. 

Read More, Comment and Share......

Admin

The Early Stages Of A Bond Bear Market

I'm crazy to do this, but it sure looks like the Great Bond Bull Market has ended and we are in the early stages of another bond bear market. 
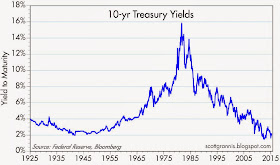
10-yr%2BTreasury%2Byields%2B25-.jpg


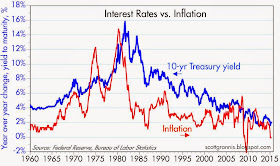
The Great Bond Bull Market started in the fourth quarter of 1981, after the 10-yr Treasury yield hit an all-time of almost 16%, and about a year after the year-over-year change in the CPI hit a post-Depression high of almost 15%. It most likely ended 31 years later, in July 2012, when the 10-yr yield fell to 1.4% at the height of the PIIGS crisis, and three years after the CPI hit a post-Depression low of -2.1%.

10-yr%2Bvs%2BCPI.jpg


As the chart above shows, inflation is arguably the principal driver of yields.

By the way, the first bond bear market of the current century started in 1950 and also lasted 31 years. The bear market that is now beginning to unfold will undoubtedly also be many years in the making, and we can only guess at how much yields will eventually rise. I certainly hope they never get as high as they did in the early 1980s, and I don't expec

Read More, Comment and Share......

Admin

According to Ashraf Laidi:  The following sobering analysis on the S&P500 reinforces our expectations that recent record highs in US equity indices will not be revisited before at least six weeks.

A decline of at least 10% is expected to follow.

-        Last week’s 3.6% decline in the S&P500 single-handedly erased all of the prior seven weeks’ consecutive gains.SPX-Oct-207-vs-Now-Dec-15-530x179.jpg?width=530

The last time the S&P500 erased at least three weeks’ of consecutive gains was the week after the October 2007 record. Stocks fell more than 50% thereafter and took six years to regain that high.

-        And for an unprecedented finding, last week’s S&P5 500 decline took place after SEVEN weekly consecutive gains, which had NEVER been seen before in the index.

Seven consecutive weekly gains have occurred in the past (Aug-Jul 1989, Aug-Sep 1993, Apr-May 1997, Feb-Mar 1998, Dec 2003-Jan 2004, Apr-May 2007, Mar-Apr 2009, Dec 2010-Jan 2011, Jan-Feb 2013), but never in any of those cases has the streak-breaking week fallen by more

Read More, Comment and Share......

We welcome you to post a blog entry, oped or share your daily reading with us as long as it is relevant to the topic of investing and not an attempt to sell a product, proprietary strategy, platform or other service. Please provide links to any research data and if re-posting other articles, give credit where credit is due providing a back link to the original site.

300 words minimum per post. You may also sort by category or search by topic. Don't forget to comment and please "share" via Facebook, Twitter and Google+. If you have any questions, please contact us.

FOLLOW STOCKBUZ

__________________

This is a member-supported site. Please donate when you can to help pay the rent. Thank you!

Stay Informed. Sign up for the FREE StockBuz eNewsletter

________________

Investing involves substantial risk. All content is subject to StockBuz disclaimer.

Create Income With Option Spreads

All content on StockBuz.net is subject to disclaimer and Terms of Service