treasuries (5)

Admin

Don't Be Fooled The Bond Rally Continues

1291344?profile=RESIZE_480x480We’ve been bulls on 30-year Treasury bonds since 1981 when we stated, “We’re entering the bond rally of a lifetime.” It’s still under way, in our opinion. Their yields back then were 15.2%, but our forecast called for huge declines in inflation and, with it, a gigantic fall in bond yields to our then-target of 3%.

The Cause of Inflation

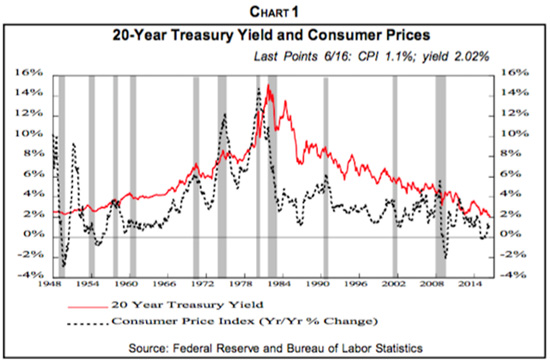
We’ve argued that the root of inflation is excess demand, and historically it’s caused by huge government spending on top of a fully-employed economy.  That happens during wars, and so inflation and wars always go together, going back to the French and Indian War, the Revolutionary War, the War of 1812, the Mexican War of 1846, the Civil War, the Spanish American War of 1898, World Wars I and II and the Korean War.  In the late 1960s and 1970s, huge government spending, and the associated double-digit inflation (Chart 1), resulted from the Vietnam War on top's LBJ’s War on Poverty.

By the late 1970s, however, the frustrations over military stalemat

Read More, Comment and Share......

Admin

Where Money's Been Flowing

When first-generation ETFs launched in the 1990s—such as the SPDR S&P 500 Trust (SPY) and the PowerShares QQQ Trust Series 1 (QQQ)—lead this year's outflows, that is a sign that institutional investors are scared. These first-to-market ETFs have the ample liquidity that big institutions tend to love, with many trading more than $500 million in volume a day. While newer ETFs that may do the same thing or more for cheaper have been launched in the intervening years, early ETFs still tend to curry favor with large investors that value liquidity. These investors tend to be more tactical, and thus outflows from these ETF stalwarts are a bearish sign. 

488x-1.jpg
Photographer: Balchunas, Eric

U.S. Treasuries of all maturities are raking in cash

According to Bloomberg, when U.S. Treasury ETFs are the brightest bright spot, that's not good. They have taken in more than $3 billion in net new cash (while junk bond ETFs have seen $2 billion in outflows). What is especially bearish is that the inflows int

Read More, Comment and Share......

Admin

BN-ED261_ChinaT_G_20140815170356.jpg?width=276The U.S. posted a record cross-border investment outflow in June as China and Japan reduced their holdings of Treasuries and private investors abroad sold bonds and notes.

The total net outflow of long-term U.S. securities and short-term funds such as bank transfers was $153.5 billion, after an inflow of $33.1 billion the previous month, the Treasury Department said in a report today. The June figure, and $40.8 billion in net selling of Treasury bonds and notes by private investors in June, were the largest on record, the Treasury said.

“Right at the beginning of June, you had a very strong sell-off of Treasuries and that’s what frightened a lot of private investors,” Gennadiy Goldberg, U.S. strategist at TD Securities USA LLC in New York, said by phone. “As yields stayed lower in subsequent months, some of the investors probably resumed their buying.”

China’s holdings of U.S. Treasuries declined by $2.5 billion to $1.27 trillion, while Japanese holdings dropped $600 million to $1.2

Read More, Comment and Share......

Admin

Which Is Wrong? Bonds Or Stocks?

1290848?profile=RESIZE_1024x1024With so much money flowing into bonds and treasuries (TLT shown) in 2014 while the stock market rose, one must wonder..........which one is going to give?  (click chart to enlarge)

Certainly it would seem not everyone believes the economy is strong enough to support future earnings and rising profits.

Is the five-year bull run finally running out of steam?

Read More, Comment and Share......

Admin

TGIF Reads

  • This day in 1896: The Dow Jones Industrial Average is first published. Its 12 initial members are the great industrial giants of the time: American Cotton Oil, American Sugar, American Tobacco, Chicago Gas, Distilling & Cattle Feeding, General Electric, Laclede Gas, National Lead, North American, Tennessee Coal & Iron, U.S. Leather, and U.S. Rubber. The index’s value that day: 40.94.  Source: Phyllis S. Pierce, ed., The Dow Jones Averages 1885-1980 (DowJones Irwin, Homewood, IL, 1982), introduction, not paginated; http://averages.dowjones.com and JasonZweig

  • Very odd the move in treasury yields today on the better than expected NFP number.  Maybe "smart money" is telling us the economy is not as strong as believed?  Extremely interesting to watch.  The Treasury market's reaction hasn't been more negative.  The 10-yr note, which was down 18 ticks shortly after the release, is now down just two ticks and yielding 2.62% (down roughly 40 bps since the end of 2013).  We still recommend ca

Read More, Comment and Share......

We welcome you to post a blog entry, oped or share your daily reading with us as long as it is relevant to the topic of investing and not an attempt to sell a product, proprietary strategy, platform or other service. Please provide links to any research data and if re-posting other articles, give credit where credit is due providing a back link to the original site.

300 words minimum per post. You may also sort by category or search by topic. Don't forget to comment and please "share" via Facebook, Twitter and Google+. If you have any questions, please contact us.

FOLLOW STOCKBUZ

__________________

This is a member-supported site. Please donate when you can to help pay the rent. Thank you!

Stay Informed. Sign up for the FREE StockBuz eNewsletter

________________

Investing involves substantial risk. All content is subject to StockBuz disclaimer.

Create Income With Option Spreads

All content on StockBuz.net is subject to disclaimer and Terms of Service