
Read More, Comment and Share......
StockBuz's Posts (693)
Sort by
These are simple but they changed my trading immensely. What tip (or 2) would you give to a new investor or trader?
How many times has this happened to you? You're "in" a stock certain you're certain it's a winner. You place a $1.00 stop because after all you don't want to lose more than $100.
The next thing you know you're stopped out, only to see it reverse and head higher without you. Was it your execution? Is the market a rigged game? Are they out to get you.....or was it the $100 you were willing to risk? Was it, in fact, large enough?
Here are a few basics I've learned since I began actively trading:
- I don't buy a the open. I wait for the opening drive to dip down, possibly even test the prior days mid-to low area OR I have a standing order waiting at a major moving average or fibonacci area (I love fibonacci!).
- I had to erase the thought of risking $1.00 on a trade (unless it's a small stock). Period. Zip. Hands down. Put it out of my head. After all, in any given week a $40 stock can pullback or fluctuate up/down 1-5% meaning (unless you're a rockstar at your entry) you're stopped out - and then it resumes heading higher with you in the dust.
Now I use technical analysis in my trading but that alone doesn't guaranty one a winner. While stops can limit losses, they actually work against you in many cases. In fact, I finally stopped using stop orders altogether because MM (Market Markers) see your stop and when at all possible, they invariably reach out and slap you silly, hit your order (providing liquidity dontcha' know) then go about their merry way.
Sure your broker may have triggers and multiple layer orders such as OCA (one cancels another) orders but for my broker (AMTD) they're very inconveniently located at their website and not on my trading platform. I have no time or patience for such silliness so I use Alerts.
I began using a 10% stop (less at times but almost always more than $1.00) and placing alerts (rather than actual stop orders) as soon as my trade was entered. Alerts telling me when to take partial profits and when I was close to my stop out point. Then I sit back...........and do absolutely nothing.
My stress levels plummeted. No longer do I worry about being stopped out. My percentage of winners have skyrocketed and not because of QE lifting the markets (they went up before the credit crisis). It's because time and time again MM couldn't reach out and grab me and I was no longer being taken out by a pullback. My losers became few. Again because my tolerance was wider, I stayed in the game.
Just where I placed my stops is an entirely different conversation but just staying in the game is an enormous struggle for young traders. I encourage papertrading with these simple methods and see if your results, bottom line and stress levels improve.
I'm continually taking partials along the way; banking profits at fib levels. No more watching a name reverse and thinking "damn, there go my profits" after the fact. My winners are all waiting for a correction to re-add shares so come on Mr. Market; bring it.
Sure my morning's can be a little crazy with bells ringing as Alerts are tripped at the open (or at the close for that matter) but my trading day is filled with research, common household tasks or running errands......and not watching my screens. Less stress, oh yes, it's a wonderful thing.
What tips would you recommend to a novice trader? What have you changed in your investment style? What have you gotten rid of?
Read More, Comment and Share......
The debate continues whether China will return to it's incredible 10% GDP pre-crisis highs with voracious appetite for all things commodity. Or whether given their own housing bubble (with empty subdivisions, malls, amusements parks and college campus's yet to be occupied) will their monetary policy now keep them on more of a sustained 7-8% path going forward.
Africa, in the meantime, continues to grow. Indeed the IMF recently predicted Ruwanda's economy to grow by over 7% in 2013. Although global slowdowns and funding due to Rebel support weighs heavily on the numbers, this type of growth is not to be dismissed (imo) . For your consideration, I submit this McKinsey quarterly article on What's Driving Africa's Growth? and ask you: Is Africa The New China?:
To be sure, Africa has benefited from the surge in commodity prices over the past decade. Oil rose from less than $20 a barrel in 1999 to more than $145 in 2008. Prices for minerals, grain, and other raw materials also soared on rising global demand.
Yet the commodity boom explains only part of Africa’s broader growth story. Natural resources, and the related government spending they financed, generated just 32 percent of Africa’s GDP growth from 2000 through 2008.2 The remaining two-thirds came from other sectors, including wholesale and retail, transportation, telecommunications, and manufacturing (Exhibit 1). Economic growth accelerated across the continent, in 27 of its 30 largest economies. Indeed, countries with and without significant resource exports had similar GDP growth rates. Read more @ McKinsey quarterly.
Read More, Comment and Share......
This in follow up to my February post pondering if the shipping index had bottomed which was most definitely chucked in to the round file by most as the market has become convinced the industry is dead. I still beg to differ.
Being a big believer in moving averages, if I see a stock or Index with rising moving averages, I take it as a sign of buying within a name. That being said, if I see falling longer term moving averages (100d and 200d), that to me signals trouble; stay away or short any pop. However when I see longer term MA's flattening.......my curiosity is peaked from a bottom fishing point of view. My first thought "is the bad news over and is it putting in a bottom?
After writing my February post, I put my money where my mouth was and bought $NAT looking for a reversal out of it's bottom (which it did) and today it absolutely plowed through it's 200d where I banked partial.
Do I believe that it will hold? No. With so many shorts it's certain to be faded *and* as most breakouts test their supports, it will as well. Will I be adding more on that test? You betcha. Do I think it'll shoot back up to the highs? Hell no and I can't believe you would ask that. This is definitely a short squeeze and it doesn't bother me one bit. Shippers definitely face a great deal of headwinds as they attempt to pass on higher prices to their customers however if the majority of the new vessels have been received, if they continue to retire old ones shrinking their fleet and if they've re-negotiated the terms of their (heavy) debt given such lower interest rates, I do not see any reason why the bottom is not truly in. At the very least, the moving averages will become my support as they continue to flatten with my stop below the January low and a partial already banked. Yes, like going to an AA meeting, my name is Kos, and I like to bottom fish.
Read More, Comment and Share......
Meet "Curt" who, as credit lines worldwide were tightening, lost his middle management job in finance in 2006. Of course Curt had no idea of what was to come. He was a good worker, great work and credit history and was lucky to have a nice nest egg saved up. He wouldn't need unemployment, no. He'd have a job in no time so he did what every good American in his position would do. He dusted off his resume, began to network/emailing his resume and paid his bills using his hard earned savings and waited.......for a job that would never come.
Then bubble burst. The market began it's long downwards spiral but Curt, undaunted, continued emailing and living off of his savings....and still did not file for unemployment. Surely something will turn up any day now, he told himself.
For four years.
Four years of bank failures, branch closings, massive consolidations and layoffs.
By 2010 the stock market was clearly rebounding however it was all over for Curt. After four long years he had drained his savings, cashed in his CDs, sold his 2nd car and withdrawn his 401k's one by one until there were no more. Even if he wanted to get back into the market to raise cash, there was no cash left to invest. His family wasn't in any better shape. There was no one to borrower from. Too late to file for unemployment now. That window was closed. His life was collapsing further. His once 760 credit score, was now sub 600. He could scarcely afford his utilities much less his mortgage. He did the only thing left to him. He sought counsel of an Attorney file to Chapter 7 (no assets).
The Lawyer, hearing Curt's plea to somehow keeps his home, advised if he felt he was going to have his mortgage modified, he could leave the house out of the Chapter 7; reaffirm with the lender and therefore not be evicted. If included in the Chapter 7, Steve would have to vacate the property within 30 days of the final filing. Steve had no where else to go and his lender had be so reassuring that he'd be granted a modification. He took the bait - reaffirmed with his lender and filed the Chapter 7. After all, he didn't want to lose his home and he was certain something would turn up soon.
Oh poor Curt.
Having no job (and no unemployment income) he was denied for a loan modification.
Badly upside down in debt now, he hosted what seemed to be a perpetual garage sale to keep the lights on and food on the table. Selling his tools, furniture, guns, even his pool in the yard simply to keep on going. His attempt to sell his home on a short sale was rejected. You see Curt had a 2nd lien holder who would receive absolutely nothing under the proposal AND to add insult to injury he now had enormous tax liens; a result of liquidating his 401k's and not being able to cover the tax on same.
The Spring of 2011 Curt finally gave up. Temp agencies were not even returning his call. Just sending him email links to apply. With his skills five years dormant and his credit destroyed, he must have felt no one wanted him (my opinion not his).
He packed what very little he could into his car, called his lender, told them he was leaving the keys on the counter and he walked away leaving all his life long possessions behind. A totally broken and beaten man.
Fast forward to 2013.
Every month since that day in 2011 Curt says he has kept in touch with his lender. He has given them his addresses as he moves from place to place. His cell phone number WHEN he can afford a pay-as-you-go phone. At some point he was diagnosed as having had "a mental break with severe depression" or what you and I would call a nervous breakdown. He hides from the public, neighbors, friends and family. Shys away from any personal interaction including eye contact. He doesn't want anyone to "see him" hiding behind sun glasses and wishes he was "invisible" doing small painting or carpet cleaning jobs. He's nervous, jumps and flinches at small everyday noises, suffers panic attacks, admits he cries each day and I believe he's now agoraphobic (afraid to go outside). His small cash jobs pay the rent but he still does not receive food stamps or a government subsidy phone. He says he has to retain what little pride he has left.
He's open to the idea of being treated for his depression again but cannot afford it. To hear him tell it, the last clinic he visited estimated his wait time to be 2-4 hours and even then, it would only be an evaluation. He wouldn't receive medication until a subsequent visit. He left the crowded, apparently smelly waiting room after only 20 minutes in a panic. "It doesn't matter" he says, "I couldn't afford meds anyway." Such is the demeanor I feel of many Americans. Deeply forlorn, empty and broken describes him well.
It's been almost two years since he gave up and handed them the keys..........and his lender has yet to foreclose. "What are they waiting for?" he wonders. His death so they can saddle the bill to his children? Indeed what are they waiting for? I wonder as well.
Read More, Comment and Share......
Reprinted from http://mauldineconomics.com
Would the Real Peter and Paul Please Stand Up?
By Dylan Grice
In a previous life as a London-based ‘global strategist’ (I was never sure what that was) I was known as someone who was worried by QE and more generally, about the willingness of our central bankers to play games with something which I didn’t think they fully understand: money. This may be a strange, even presumptuous thing to say. Surely of all people, one thing central bankers understand is money?
They certainly should understand money. They print it, lend it, borrow it, conjure it. They control the price of it... But so what? What should be true is not necessarily what is true, and in the topsy-turvy world of finance and economics, it rarely is. So file the following under “strange but true”: our best and brightest economists have very little understanding of economics. Take the current malaise as prima facie evidence.
Let me illustrate. Of the many elemental flaws in macroeconomic practice is the true observation that the economic variables in which we might be most interested happen to be those which lend themselves least to measurement. Thus, the statistics which we take for granted and band around freely with each other measuring such ostensibly simple concepts as inflation, wealth, capital and debt, in fact involve all sorts of hidden assumptions, short-cuts and qualifications. So many, indeed, as to render reliance on them without respect for their limitations a very dangerous thing to do. As an example, consider the damage caused by banks to themselves and others by mistaking price volatility (measurable) with risk (unmeasurable). Yet faith in false precision seems to us to be one of the many imperfections our species is cursed with.
One such ‘unmeasurable’ increasingly occupying us here at Edelweiss is that upon which all economic activity is based: trust. Trust between individuals, between strangers, between organizations... trust in what people read, and even people’s trust in themselves. Let’s spend a few moments elaborating on this.
First, we must understand the profound importance of exchange. To do this, simply look around you. You might see a computer monitor, a coffee mug, a telephone, a radio, an iPad, a magazine, whatever it is. Now ask yourself how much of that stuff you’d be able to make for yourself. The answer is almost certainly none. So where did it all come from? Strangers, basically. You don’t know them and they don’t know you. In fact virtually none of us know each other. Nevertheless, strangers somehow pooled their skills, their experience and their expertise so as to conceive, design, manufacture and distribute whatever you are looking at right now so that it could be right there right now. And what makes it possible for you to have it? Exchange. To be able to consume the skills of these strangers, you must sell yours. Everyone enters into the same bargain on some level and in fact, the whole economy is nothing more than an anonymous labor exchange. Beholding t he rich tapestry this exchange weaves and its bounty of accumulated capital, prosperity and civilization is a marvelous thing.
But we must also understand that exchange is only possible to the extent that people trust each other: when eating in a restaurant we trust the chef not to put things in our food; when hiring a builder we trust him to build a wall which won’t fall down; when we book a flight we entrust our lives and the lives of our families to complete strangers. Trust is social bonding and societies without it are stalked by social unrest, upheaval or even war. Distrust is a brake on prosperity, because distrust is a brake on exchange.
But now let’s get back to thinking about money, and let’s note also that distrust isn’t the only possible brake on exchange. Money is required for exchange too. Without money we’d be restricted to barter one way or another. So money and trust are intimately connected. Indeed, the English word credit derives from the Latin word credere, which means to trust. Since money facilitates exchange, it facilitates trust and cooperation. So when central banks play the games with money of which they are so fond, we wonder if they realize that they are also playing games with social bonding. Do they realize that by devaluing money they are devaluing society?
To see the how, first understand how monetary policy works. Think about what happens in the very simple example of a central bank’s expanding the monetary base by printing money to buy government bonds.
That by this transaction the government has raised revenue for the government is obvious. The government now has a greater command over the nation’s resources. But it is equally obvious that no one can raise revenue without someone else bearing the cost. To deny it would imply revenues could be raised for free, which would imply that wealth could be created by printing more money. True, some economists, it seems, would have the world believe there to be some validity to such thinking. But for those of us more concerned with correct logical practice, it begs a serious question. Who pays? We know that this monetary policy has redistributed money into the government’s coffers. But from whom has the redistribution been?
The simple answer is that we don’t and can’t know, at least not on an amount per person basis. This is unfortunate and unsatisfactory, but it also happens to be true. Had the extra money come from taxation, everyone would at least know where the burden had fallen and who had decreed it to fall there. True, the upper-rate tax payers might not like having a portion of their wealth redirected towards poorer members of society and they might not agree with it. Some might even feel robbed. But at least they know who the robber is.
When the government raises revenue by selling bonds to the central bank, which has financed its purchases with printed money, no one knows who ultimately pays. In the abstract, we know that current holders of money pay since their cash holdings have been diluted. But the effects are more subtle. To see just how subtle, consider Cantillon’s 18th century analysis of the effects of a sudden increase in gold production:
If the increase of actual money comes from mines of gold or silver... the owner of these mines, the adventurers, the smelters, refiners, and all the other workers will increase their expenditures in proportion to their gains. ... All this increase of expenditures in meat, wine, wool, etc. diminishes of necessity the share of the other inhabitants of the state who do not participate at first in the wealth of the mines in question. The altercations of the market, or the demand for meat, wine, wool, etc. being more intense than usual, will not fail to raise their prices. ... Those then who will suffer from this dearness... will be first of all the landowners, during the term of their leases, then their domestic servants and all the workmen or fixed wage-earners ... All these must diminish their expenditure in proportion to the new consumption.
In Cantillon’s example, the gold mine owners, mine employees, manufacturers of the stuff miners buy and the merchants who trade in it all benefit handsomely. They are closest to the new money and they get to see their real purchasing powers rise.
But as they go out and spend, they bid up the prices of the stuff they purchase to a level which is higher than it would otherwise have been, making that stuff more expensive. For anyone not connected to the mining business (and especially those on fixed incomes: “the landowners, during the term of their leases”), real incomes haven’t risen to keep up with the higher prices. So the increase in the gold supply redistributes money towards those closest to the new money, and away from those furthest away.
Another way to think about this might be to think about Milton Friedman’s idea of dropping new money from a helicopter. He used this example to demonstrate how easy it would theoretically be for a government to create inflation. What he didn’t say was that such a drop would redistribute income in the same way more gold from Cantillon’s mines did, towards those standing underneath the helicopter and away from everyone else.
So now we know we have a slightly better understanding of who pays: whoever is furthest away from the newly created money. And we have a better understanding of how they pay: through a reduction in their own spending power. The problem is that while they will be acutely aware of the reduction in their own spending power, they will be less aware of why their spending power has declined. So if they find groceries becoming more expensive they blame the retailers for raising prices; if they find petrol unaffordable, they blame the oil companies; if they find rents too expensive they blame landlords, and so on. So now we see the mechanism by which debasing money debases trust. The unaware victims of this accidental redistribution don’t know who the enemy is, so they create an enemy.
Keynes was well aware of this insidious dynamic and articulated it beautifully in a 1919 essay:
By a continuing process of inflation, governments can confiscate, secretly and unobserved, an important part of the wealth of their citizens. By this method they not only confiscate, but they confiscate arbitrarily; and, while the process impoverishes many, it actually enriches some.... Those to whom the system brings windfalls... become “profiteers” who are the object of the hatred.... the process of wealth-getting degenerates into a gamble and a lottery.
Lenin was certainly right. There is no subtler, no surer means of overturning the existing basis of society than to debauch the currency. The process engages all the hidden forces of economic law on the side of destruction, and does it in a manner which not one man in a million is able to diagnose.
Deliberately impoverishing one group in society is a bad thing to do. But impoverishing a group in such an opaque, clandestine and underhanded way is worse. It is not only unjust but dangerous and potentially destructive. A clear and transparent fiscal policy which openly redistributes from the rich to the poor can at least be argued on some level to be consistent with ‘social justice.’ Governments can at least claim to be playing Robin Hood. There is no such defense for a monetary driven redistribution towards recipients of the new money and away from everyone else because if the well-off are closest to the money, well, it will have the perverse effect of benefitting them at the expense of the poor.
Take the past few decades. Prior to the 2008 crash, central banks set interest rates according to what their crystal ball told them the future would be like. They were supposed to raise them when they thought the economy was growing too fast and cut them when they thought it was growing too slow. They were supposed to be clever enough to banish the boom-bust cycle, and this was a nice idea. The problem was that it didn’t work. One reason was because central bankers weren’t as clever as they thought. Another was because they had a bias to lower rates during the bad times but not raise them adequately during the good times. On average therefore, credit tended to be too cheap and so the demand for debt was artificially high. Since that new debt was used to buy assets, the prices of assets rose in a series of asset bubbles around the world. And this unprecedented, secular and largely global credit inflation created an illusion of prosperity which was fun for most people while it lasted.
But beneath the surface, the redistributive mechanism upon which monetary policy relies was at work. Like Cantillon’s gold miners, those closest to the new credit (financial institutions and anyone working in finance industry) were the prime beneficiaries. In 2012 the top 50 names on the Forbes list of richest Americans included the fortunes of eleven investors, financiers or hedge fund managers. In 1982 the list had none.
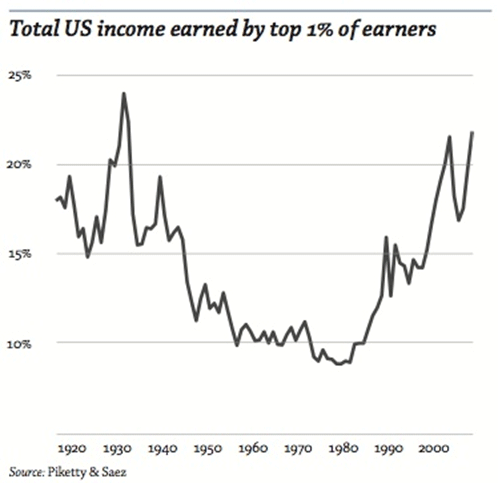
Besides this redistribution of wealth towards the financial sector was a redistribution to those who were already asset-rich. Asset prices were inflated by cheap credit and the assets themselves could be used as collateral for it. The following chart suggests the size of this transfer from poor to rich might have been quite meaningful, with the top 1% of earners taking the biggest a share of the pie since the last great credit inflation, that of the 1920s.
Who paid? Those with no access to credit, those with no assets, or those who bought assets late in the asset inflations and which now nurse the problem balance sheets. They all paid. Worse still, future generations were victims too, since one way or another they’re on the hook for it. So with their crackpot monetary ideas, central banks have been robbing Peter to pay Paul without knowing which one was which. And a problem here is this thing behavioral psychologists call self-attribution bias. It describes how when good things happen to people they think it’s because of something they did, but when bad things happen to them they think it’s because of something someone else did. So although Peter doesn’t know why he’s suddenly poor, he knows it must be someone else’s fault. He also sees that Paul seems to be doing OK. So being human, he makes the obvious connection: it’s all Paul and people like Paul’s fault.
But Paul has a different way of looking at it. Also being human, he assumes he’s doing OK because he’s doing something right. He doesn’t know what the problem is other than Peter’s bad attitude. Needless to say, he resents Peter for his bad attitude. So now Peter and Paul don’t trust each other. And this what happens when you play games with society’s bonding.
When we look around we can’t help feeling something similar is happening. The ïï% blame the 1%; the 1% blame the 47%. In the aftermath of the Eurozone’s own credit bubbles, the Germans blame the Greeks. The Greeks round on the foreigners. The Catalans blame the Castilians. And as 25% of the Italian electorate vote for a professional comedian whose party slogan “vaffa” means roughly “f**k off” (to everything it seems, including the common currency), the Germans are repatriating their gold from New York and Paris. Meanwhile in China, that centrally planned mother of all credit inflations, popular anger is being directed at Japan, and this is before its own credit bubble chapter has fully played out. (The rising risk of war is something we are increasingly worried about...) Of course, everyone blames the bankers (“those to whom the system brings windfalls... become ‘profiteers’ who are the object o f the hatred”).
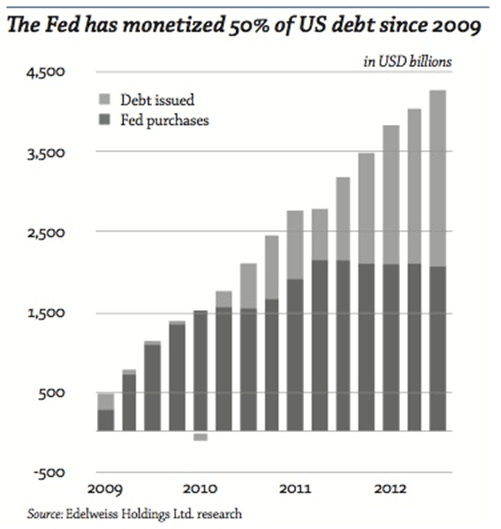
But what does it mean for the owner of capital? If our thinking is correct, the solution would be less monetary experimentation. Yet we are likely to see more. Bernanke has monetized about a half of the federally guaranteed debt issued since 2009 (see chart below). The incoming Bank of England governor thinks the UK’s problem hasn’t been too much monetary experimentation but too little, and likes the idea of actively targeting nominal GDP. The PM in Tokyo thinks his country’s every ill is a lack of inflation, and his new guy at the Bank of Japan is revving up its printing presses to buy government bonds, corporate bonds and ETFs. China’s shadow banking credit bubble meanwhile continues to inflate…
For all we know there might be another round of illusory prosperity before our worst fears are realized. With any luck, our worst fears never will be. But if the overdose of monetary medicine made us ill, we don’t understand how more of the same medicine will make us better.
We do know that the financial market analogue to trust is yield. The less trustful lenders are of borrowers, the higher the yield they demand to compensate. But interest rates, or what’s left of them, are at historic lows. In other words, there is a glaring disconnect between the distrust central banks are fostering in the real world and the unprecedented trust lenders are signaling to borrowers in the financial world.
Of course, there is no such thing as “risk-free” in the real world. Holders of UK cash have seen a cumulative real loss of around 10% since the crash of 2008. Holders of US cash haven’t done much better. If we were to hope to find safety by lending to what many consider to be an excellent credit, Microsoft, by buying its bonds, we’d have to lend to them until 2021 to earn a gross return roughly the same as the current rate of US inflation. But then we’d have to pay taxes on the coupons. And we’d have to worry about whether or not the rate of inflation was going to rise meaningfully from here, because the 2021 maturity date is eight years away and eight years is a long time. And then we’d have to worry about where our bonds were held, and whether or not they were being lent out by our custodian. And of course, this would all be before we’d worried about whether Microsoft’s business was likely to remain safe over an eight year horizon.
We are happy to watch others play that game. There are some outstanding businesses and individuals with whom we are happy to invest. In an ideal world we would have neither Peters nor Pauls. In the imperfect one in which we live, we have to settle for trying hard to avoid the Pauls, who we fear mistake entrepreneurial competence for proximity to the money well. But when we find the real thing, the timeless ingenuity of the honest entrepreneurs, the modest craftsmen and craftswomen who humbly seek to improve the lot of their customers through their own enterprise, we find inspiration too, for as investors we try to model our own practice on theirs. It is no secret that our quest is to find scarcity. But the scarce substance we prize above all else is trustworthiness. Aware that we worry too much in a world growing more wary and distrustful, it is here we place an increasing premium, here that we seek refuge from financial folly and here that we expect the next bull market.
Read More, Comment and Share......
For those who found themselves busy fertilizing their lawns and Spring cleaning this weekend, you missed a market-moving decision as Cyprus announced (quite conveniently after Fridays close) an unprecedented levy on all bank deposits of 6.75% for accounts below $100,000 euros, and 9.9% for $100,00 euros and above. OUCH
Adding insult to injury, if you lived in Cyprus and needed cash from an ATM machine, you were out of luck as Cypriots awoke to find bank transfers already frozen as the government prepares to seize the assets when their banks re-open on the 19th although the glimmer of hope exists the final vote tomorrow could fail (there must be a joke there somewhere about PIIGS and flying).
All the talk from EU politicians. All the promises that the Euro would be fine. All of the money printing. All of the haircuts already taken. Blah blah blah blah.......and here we go again.
My hats off to whomever bought the enormous volume in VXX end of Feburary. (click on chart to enlarge) That hedge should payoff nicely on this news. Don't you find it quite coincidental that these Greek news came out AFTER the U.S. released their bank stress tests results? (hehehe)
One would also assume that the reigning Corporate elite and their buddy banksters overseas are having an ever more difficult time squeezing money out of the little guy going forward because simply put, there ain't none left.
Given what the "trickle down" effect did to U.S. assets over the last 30 years, I wouldn't be at all surprised to see the U.S. encounter further resistance from their citizens as well **if** fear isn't contained, and quickly. Needless to say every dog-n-pony show will be out this week to reassure capital markets. After all, OUR U.S. banks passed their stress tests....don't panic..........all is well. (*cough cough* what about their exposure to overseas banks????) Well we've all been waiting for a correction - maybe this'll be the catalyst.
Now I would think the topics of taxing the wealthy, income distribution and wealth inequality have already been to death but thanks to Cyprus, here we go again. *sigh* Oh the pain........
Read More, Comment and Share......
Cue Gomer Pyle.
The consumer is alive and well. In fact the consensus for consumer sales was for a paltry 0.6% and it came in at 1.1% with prior revisions being moved up rather than down leaving even Rick Santelli somewhat speechless with nothing to complain over in the details. This proving once again that all the fear mongering about allowing temporary tax breaks to expire and dreaded sequestration cuts would kill the consumer were an outright fallacy. If used to influence votes in Congress and you'd think at some point those men and women would learn how to play the game.
In fact this release could prove to be a game changer from a chartist point of view if the trend continues higher. While some may remain nonbelievers, we have Easter purchasing as well as Spring dead ahead which can do nothing but boost spending further. Bring it!
What a shocker people still need to eat and last time I looked, small children continue to outgrow shoes and clothing requiring new. We all still needed fuel to drive to work. I guess bicycles aren't flying off the showroom floor. I haven't noted any huge increase in sewing machine sales anywhere with the impoverished forced to make their own clothing nor are people flocking to become share croppers that I'm aware of. Certainly consumer discretionary will take it on chin with fewer furniture and auto sales postponed but come on now, you have to admit it's encouraging. To coin an old phrase "a girl's gotta eat" and yes, the consumer clearly still has a pulse.
Read More, Comment and Share......
Today was a typical Saturday. I began to scan my watchlist, ran through the indexes and flipped through my favorite web pages for tidbits of stockmarket insight. At one point I noticed that in wake of yesterdays selloff in gold/silver, suddenly people were posting seasonal charts for gold and silver.....as if they had just been discovered. Helllllo McFly. No, there is no seasonal demand for the shiny stuff here. Hasn't been; move along. Economies are healing; meaning there's less of a need to hedge yourself with gold and bonds. With no demand and less of a flight to safety,the big boys are taking profits. Again, nothing there, move along.
I think some people just stopped paying attention but world economies are less bad, period. While we're not out of the woods, unemployment is stabilizing. Jobs are coming back, albeit slowly and low paying...but things are no longer deteriorating. Maybe the gurus out there just didn't want their subscribers to know the secret to their approach (wink wink). Some struggled attempting to get long the shiny stuff and wait for a pop allthewhile wondering why gold wasn't skyrocketing to $2500 (as some pundits have predicted), we stood aside focusing on better areas to deploy our cash.
You see, we talk about seasonal demand a great deal at StockBuz.net using it to enter quite a few trades throughout the year; and you don't have to trade commodity futures in order to benefit. That's why the trading Gods made ETFs. Utlizing past history, we know what the odds are of success. We know what commodity or sectors are coming into strength and make efforts to position accordingly. Fact is many a trader has cleaned up on seasonal patterns and have penned books on it's usage. Don't get too excited however; it's not the holy grail of investing dear reader. Don't even go there - there is no such thing. At times it doesn't "work" if there's a change in sentiment or trend, over (or under) supply of a certain commodity due to unforeseen circumstances such as drought or worker strike and then there's those pesky, panicky news headlines (Greece is about to fail!); just to name a few. However quite often when market sentiment is right, there exists great reward when technical analysis is telling you otherwise......all because seasonal demand for a commodity (or yes, even a sector) kicks in.
We discussed in November/December that XLF would run for $19.50-20.00; that energy would strengthen, gasoline would run, OIH breakout and small caps to take the lead. They did. We talked about Platinum and industrials. We didn't wait for a guru to post a chart. We have a plethora of seasonal charts at our disposal. We have no "gurus" with subscription fees @ StockBuz; everyone shares their knowledge. We knew the seasonals and 2013 is off to a rip roaring start. Maybe some of you need to brush up on your seasonal knowledge.....or better yet just join us.
Read More, Comment and Share......
Leading up to the market peak, shippers made the fatal error of buying the boom frenzy and ordering the construction of new ships. Once credit markets constricted it was too late for shippers to turn back. By 2009 the dime had been dropped, orders placed, payment promised, they saw a total a total collapse of freight rates; each battling the other for dwindling world wide business (see video)
Many traders believed QE would lift all boats (pun intended) and struggled over and over again to find a bottom in the Baltic Dry Index but to no avail. Wasn't China going to stockpile again? For years we had be "programmed" to that belief. Many simply did not comprehend the impact of world-wide tightening and slowdown, even in China. Voracious demand did not return and oversupply of vessels meant freight rates continued to see pressure even with the Feds money printing as new ships continued to be delivered.
Then finally, a glimmer of hope. Moodys projected that most new ships would be delivered in 2012 or 2013. Market theory began circulating that maybe, just maybe the end was approaching. In the meantime, shippers have been on a long road to healing and that's a good thing........for those names who survive and don't find their way to the OTC graveyard. Record low rates have allowed for credit terms to be renegotiated and M&A may be heating up. NAT recently completed its acquisition of Scandic American and DSX announced a new loan facility, just to name a few. I imagine we'll see much more of the same going forward as global economies heal and business prospects improve. Old vessels continue to be retired/scrapped and with any luck all new deliveries will be completed in due course.
The glimmer of hope may be a lighthouse with prospects of higher shipping rates coming in May; as much as 50% higher in fact which would be a wonderful development.
From a chartist point of view, 2012 may well have been a year of forming a bottom or basing but only time will tell.
$BDI appears to be supported at these lower levels and there has been talk of Asian interests in shipping names. I personally have begun to accumulate NAT as a drawer stock and will continue to accumulate going forward. I will confess quite often I am too early to the party and there remains the chance of more pain to come but if you ask me if shippers are closer to the lighthouse and safe harbors? I for one truly believe so.
Read More, Comment and Share......
You know those moments.......when you were at a family function or out for a few cocktails with friends when someone brought up the topic of the economy or stock market. Those conversations were fairly easy to side step and ensure you'd still be on speaking terms tomorrow. The last five years, however it's an entirely new ballgame and avoidance is not becoming any easier. I think the basic problem for the general public (and many small investors) is that they expected a snap back in jobs in 2-3 years, as is normal after a recession. The problem isn't the current administration. The problem is that we didn't simply experience a recession. We experienced a global financial crisis which is a horse of an entirely different color.
You really can't blame them for not understanding the difference between the two. Most haven't been alive long enough or have knowledge of economic history to realize the ramifications. According to a White House Crisis and Recovery in the World Economy "Although economic dislocations have been severe in one region or another at various times over the past 50 years, never in that time span has the annual output of the entire global economy contracted." The end result boys and girls is not a 2-3 year rebound. The Washington Post warned: housing prices tend to be depressed for years, and credit deleveraging takes about seven years. Additionally, real per capita GDP growth is significantly lower in the decade following a financial crisis. Even today with global central banks easing, the recovery is far from over according to Bloomberg. So where are we truly in the deleveraging process? Roubini Global Economics breaks it down. Enjoy-
By Christian Menegatti and David Nowakowski
Roubini Global Economics
• Question: Are U.S. households done deleveraging? Answer: Getting there; thanks to consumer credit rebounding, household debt increased in Q2 2012, for the first time since 2008, although it dipped again in Q3. Consumer credit held up with a significant acceleration in the pace of releveraging in 2012. Mortgage debt is still shrinking, as homeowners seek to rebuild equity or default.
• Question: Why does it matter? Answer: It matters because deleveraging acts like gravity on economic activity, with repayment of debt sopping up income that would otherwise go into consumption and housing. The good news is that the housing market is looking a bit brighter after five years of residential investment contraction and will provide a significant contribution to GDP growth going forward. However, the welcome housing reflation will be too weak to boost the asset side of household balance sheets and consumption through wealth effects.
• The financial sector is still deleveraging rapidly, partly as securitization markets and government enterprises continue to shrink. Corporations and small businesses are both leveraging up; the former robustly (although nowhere near the pre-2008 pace), the latter anemically. Unfortunately, this borrowing seems to be mainly for refinancing, cash hoarding and equity buybacks, along with some investment in capital stock, but little hiring.
• Question: What does it mean for economic activity and asset classes? Answer: The end of private- sector deleveraging, and, eventually, credit growth increasing to the level of economic growth, will boost U.S. growth closer to its potential rate of 2.5-3.0%. It will allow for slower savings growth, more investment and smaller fiscal deficits. Unlike Japan, which remains in deleveraging mode decades after its bust, the U.S. seems close to ending this painful period of balance-sheet repair, and avoiding the lost decades of ZIRP and dismal equity market returns that come with it.
Here Is How the Story Goes...
RGE’s focus has always been on national balance sheets and the signals of health or sickness that those can send. In this case, the patient is the U.S. economy; the Flow of Funds Accounts of the United States (the Fed Z.1 report) is our quarterly doctor’s visit. U.S. households are very familiar with deleveraging; associated with an economy that will take a long time to return to potential growth and full unemployment. But is the medicine working?
Being in the postcrisis, Minsky-moment aftermath makes us the lucky witnesses of a once-in-a-generation event (one hopes). After over 60 years of almost monotonic growth in the U.S. total debt-to-GDP ratio, the Great Recession unleashed a painful deleveraging process that depressed private demand and pushed policy makers into several rounds of fiscal and monetary stimuli. While fiscal stimulus (a.k.a., releveraging of the public sector to offset the private-sector deleveraging cycle) is now turning into a drag on growth and source of uncertainty, and potentially a heavy one, the Fed has made its open-ended monetary easing stance contingent to labor market performance. Monetary policy can ease financial conditions and can build a bridge to a “better day” (a day in which deleveraging and uncertainty are gone), bu t it is the progress of balance-sheet repair of the household and financial sectors that will actually bring that “better day” a bit closer—the Fed has decided to extend the bridge as long as needed, conditional on inflation (actual and expected) developments.
So, Is Private-Sector Balance-Sheet Repair Over? And Is That ‘Better Day’ on the Horizon?
Pages 8 and 18 of Z.1 tell us that, in Q2 2012, total household credit flows printed a positive number, to the tune of $161 billion, for the first time since Q1 2008 (with the exception of a tiny blip in Q4 2011). That is a far cry from the average quarterly total household credit contraction that we lived with between Q2 2008 and Q1 2012. Unfortunately, Q3 2012 did not repeat the expansion of Q2. With a contraction of $262 billion, Q3 2012 was a bit worse than the average quarterly flow of the last four years. So, almost five years since the official beginning of the Great Recession, how far are U.S. households, in aggregate, into their deleveraging process?
Total Household Credit: Good News and Bad News
Without oversimplifying much, we can break down total household credit into consumer credit and mortgage credit. The good story is in consumer credit; the not so good story in on the mortgage side.
Consumer Credit
Household consumer credit collapsed heavily post-Lehman and relapsed two years later, starting in late 2010, displaying an almost V-shaped recovery (Figure 1). The flow for Q3 2012 ($116 billion) was a bit weaker than in Q2 ($173 billion) but, nevertheless, the trend remains positive and intact.

Source: Federal Reserve
Mortgage Credit
Mortgage flows are still bad news and have been in negative territory since Q2 2008 (Figure 2). The mortgage sector remains stuck in deleveraging mode, even with home affordability at an all-time high. In H1 2012, flows of mortgages obtained by households were as bad as they have ever been since the beginning of this crisis—it does not look like there is much of an improvement there yet. Most likely, this is not just due to the supply side (the broken banking-credit-market channel that the Fed is trying to fix); the demand side is not yet feeling like loading up debt to buy a home.
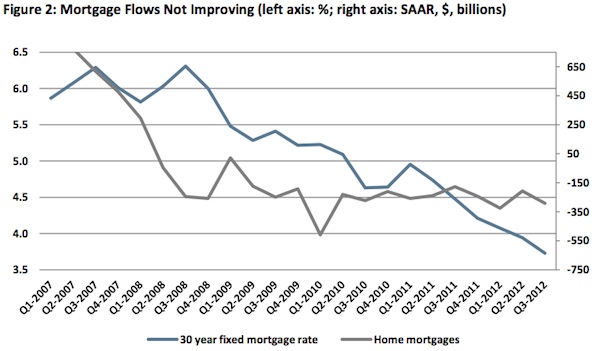
Source: Federal Reserve and Federal Home Loan Mortgage Group
So, How Are U.S. Households Feeling?
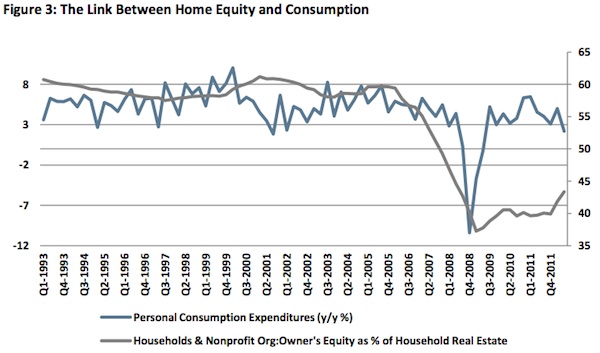
Home equity was allegedly an important driver for consumption (and consumer credit growth) and sentiment (Figure 3). The good news is that home equity as a percentage of household real estate is improving, albeit very slowly, after the collapse of 2007. As homeowners gradually rebuild equity through repayments, and if home prices, after triple-dipping, start to recover in line with inflation, this long-time drag on economic activity could fade within the next year.
Source: Bureau of Economic Analysis and Federal Reserve
Stocks: Housing Matters...
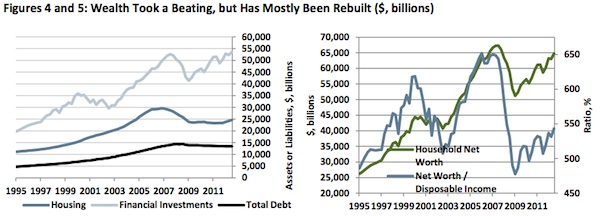
So far, we have only discussed flows. Looking at stocks (levels) gives us a better sense of where we are in the debt/asset journey. Housing is by far the largest single asset on the balance sheet of U.S. households (about $19 trillion out of $78 trillion of total assets). Clearly, U.S. households’ wealth effects and net worth depend a lot on what happens to home prices, where the future for both prices and quantities looks a bit brighter. RGE expects housing starts to grow by a whopping 30% in 2013 and to reach the 1.1 million mark at year-end (annualized rate; housing starts peaked at over 2.2 million in early 2006). Although residential investment is just about 3% of U.S. GDP, and therefore its contribution to growth is limited (about 0.4% in 2013), a housing recovery would have a positive multiplier effect and give a push to housing-related consumption.
The recent trajectory of growth in starts would suggest an even faster pickup. Estimates of housing needs are consistent with starts increasing to well over 1 million, and moving closer to 1.5 million-1.8 million eventually— depending on demand for second homes, capital replacement and household formation, including assumptions on immigration. That number might be a bit high given household formation collapsed during the recession to below 500,000 per year, from the 1.7 million per year in the decade prior to 2007, but a catch-up does need to take place, although some of it may be in rentals (multi-family or commercial real estate) rather than single-family starts.
On the price side, we forecast nominal house price gains of 4.0% in 2013 and 5.2% in 2014. This pace of housing reflation is insufficient to bring significant positive wealth effects; although $1.75 trillion of additional property wealth is nothing to sneeze at, it only makes up for a fraction of the value “lost” in the housing bust. However, the improvement will boost the sentiment of all those households that remain in negative equity, with no income or no income growth and with a high ratio of debt to disposable income that will force them to continue their deleveraging process. And those households might happen to be those with the highest propensity to consume.
In fact, it is overall wealth, arguably, that needs to be restored to something like its previous level before savings, leverage and consumption patterns are able to return to a more “normal” state. Figures 4 and 5 show that, despite the rebound in equity markets, household net worth in nominal terms is now probably back at its precrisis high of around $67 trillion, but still far off the precrisis trend. On another measure, wealth is at 5.5x income; much improved from 2009, but still only at the levels seen early on in the 1995-2000 “Clinton” and 2003-08 “Bush” recoveries. There is no clear-cut answer as to what wealth ought to be, and demographics and inequality may also play a role. But, after four years of deleveraging, the asset side of the balance sheet seems in good enough shape not to be an obstacle to credit growth. Could something else be holding it back?
Source: Haver, Federal Reserve
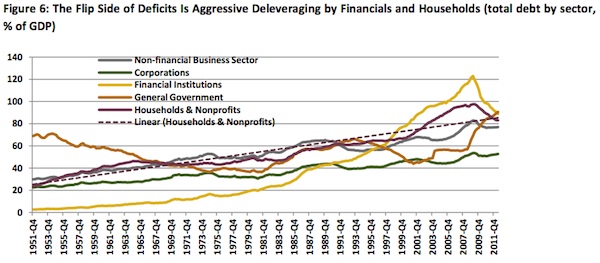
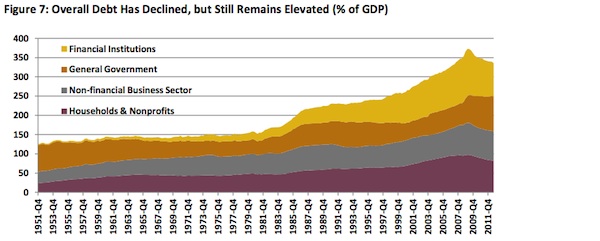
As Figures 6 and 7 indicate, deleveraging on the private side of the economy has been the flip side of the large government deficits. (In fact, the urge to save and the need to default—rather than stimulus—is the main cause of the sustained slump that is in turn the main cause of the reduced revenues and thus the fiscal deficits.) Figure 6 suggests that, compared with the post-World War II trend of rising household indebtedness, the recent debt reduction is already enough. But there is no financial or economic argument for this trend being the right long- term equilibrium. If wealth and income levels are back to mid-1990 levels, and economic uncertainty at 1970-90 levels, then household indebtedness might be more appropriate at 65% of GDP or even 50% of GDP. Even if the current pace of GDP growth combined with defaults and savings continues, it would take until 2016 or 2019 to reach those levels once more.
Source: Haver, Federal Reserve
Source: Haver, Federal Reserve
A potential problem with the above estimates (indeed, with using debt/GDP or debt/income at all) is that they compare stocks with flows, and the resulting numbers are not just percentages, but should be given the correct units, which are “years.” There is no reference to the cost of the debt, its maturity, assets or growth of GDP.
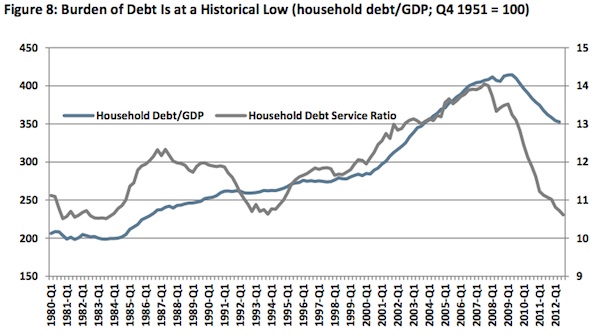
One additional and useful measure would be the amount needed to service the debt. The Fed measures this by dividing the estimated payments on debt (inc. principal; e.g., minimum payments on credit cards and mortgage amortizations) by disposable personal income. In this way, longer maturities and lower real interest rates are better captured—and the result looks dramatically different, as shown in Figure 8. At 10.6% of income, the actual burden of debt is as low as it was in the early 1980s and early 1990s, after recessions and rate cuts. The broader measure, which includes auto lease payments, rent, homeowner’s insurance and property tax, is likewise near its historical troughs (below 16% of income, down from 19% in 2007). Although there was not the dramatic net deleveraging the U.S. is experiencing now, after a period of 4 years in the first case and 2.5 years in the latter, robust growth and leveraging were ready to begin again, and even tolerate aggres sive hiking cycles. However, in the early 1980s and 1990s, inflation (and nominal GDP) was running at over 10% and 6%, respectively—that has not been the case during this deleveraging episode.
Source: Household Debt Service and Financial Obligations Ratios and U.S. Flow of Funds reports, Federal Reserve
Enter the Fed
The Fed is determined to push on a string until a significant improvement in labor-market conditions comes about. This will help nominal growth (rather than real), which seems to be the goal/target at this point (and not just for the Fed)—and also hopefully the achievement of an even more beautiful deleveraging..., comparing and contrasting with that of Japan for example (Figures 9 and 10).
Source: Bureau of Economic Analysis, U.S. Treasury, Bank of Japan and Cabinet Office of Japan
QE3 will help prompt another wave of refinancing, but will it unlock the credit channel? The other not so good news on page 8 of the Fed’s Z.1 report is that the domestic financial sector is still in deleveraging mode (Figure 11).
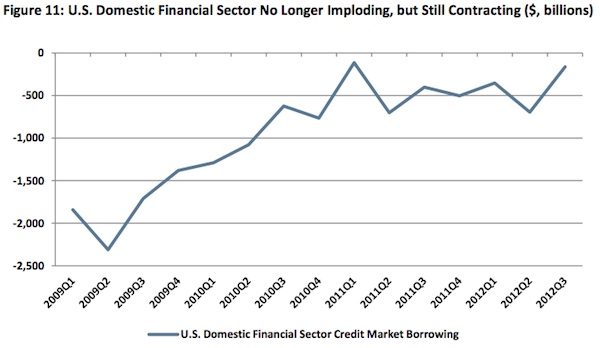
Source: U.S. Flow of Funds, Federal Reserve
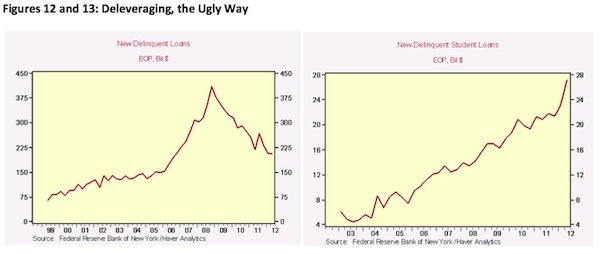
It is important to remember that deleveraging is a vague term, if not a euphemism. Although it can take place through the saving and repayment of debt, it is also possible through other processes: Namely, default and inflation/growth. While nominal GDP growth is anemic, time is an important factor in the healing process. Defaults, on the other hand, are quick, but painful. And there has been plenty of pain to go around, but it is largely abating (Figures 12 and 13). In particular, after the spurt of subprime and Alt-A defaults that were inevitable, the bottoming out of housing, the belated and poorly implemented HARP programs and the weak recovery have stabilized mortgage defaults and foreclosures. If there is one sector to be worried about, it is student loans. Although these loans are largely a federal exposure and total a mere $ 1 trillion (and so unlikely to trigger a systemic financial explosion), the sector is now bigger than auto loans or credit card debt, and is likely to be a dual burden on the current crop of college graduates, together with joblessness and underemployment.
Source: Federal Reserve Bank of NY, Haver
Conclusion
From a balance-sheet perspective, the U.S. household sector is coming to the end of its period of deleveraging that began in 2008. Wealth has been rebuilt (Figures 4 and 5), debt has been cut through defaults and repayment, and incomes have recovered (Figure 14 shows the detailed decomposition of this process). As long as interest rates remain low, and deflation is avoided, a more normal period may soon begin, although debt levels in some sectors remain high. As households join corporates in borrowing (at a rate, one hopes, more in line with incomes and demographics), consumption and investment (residential and capital) will support a rate of GDP growth that will gradually return to the potential level, even as the baton is passed from government income support and generous tax cuts. But important questions to keep in mind, which we will address in forthcoming analysis, include the following:
• What will happen to real wages, disposable income growth and savings?
• Will the mini releveraging cycle, helped by low real rates and painstaking repayment, be killed off by the fiscal adjustment in the U.S. (even if the austerity is not as severe as it might have been under a full “cliff” scenario)?
• Will recession/slowdown in the eurozone and China damage corporates and banks via financial conditions and sentiment, or hurt household balance sheets via the equity markets?
• And even if assuming that deleveraging in the private sector is over in aggregate and across different types of liabilities, what will credit growth look like in the U.S. in the near future, and to what levels will leverage converge in the medium term... and what would that mean for growth?

Source: RGE
Source: RGE, Bloomberg, Federal Reserve Bank of St. Louis FRED
Reprinted with authorization from John Mauldin Outside The Box http://mauldineconomics.com
Read More, Comment and Share......
Growing up on the South side of Chicago, you learned two lessons at an early age. If it was Sunday afternoon you didn't walk in front of the (tiny black & white) television screen and you never, ever tried to change the channel if the Bears were playing.........not if you were partial to keeping your arm. Sunday afternoons were a time of pigskin worship and the Superbowl.....the ultimate homage. Those were our idols. Our supermen. Plowing through linemen in December slush with chunks of turf in their face mask; there was no greater glory. Just how much longer this sport remains as it is, I'm beginning to worry.
I don't say this because of the sky high regular season tickets prices with an average of $144 a piece; sufficient to feed a family of four for a week. It's not because it's falling in popularity. In fact according to a Harris poll, in 2012 football became the #1 most popular sport in the U.S. surpassing America's past time, baseball. In fact betting on NFL games is now more popular in the U.S. than college football or baseball; a stat I never thought I'd see given it's short season and limited number of teams.
It is because greed saw an area to exploit; to drive higher and higher at a much faster pace than income levels. Then the credit crisis hit but prices continued to soar and like all bubbles, it will eventually pop. Fast approaching are the days when only the upper crust will be able to afford to take the kiddies to the fame. Who will fill the stands?
Then there's belt tightening to improve the bottom line. Bear fans still haven't gotten over losing their beloved Honey Bears and five other teams have followed suit but there's more to come. It's no small wonder how the weakening of unions over the last 60 years didn't hurt the fall of manufacturing jobs. The same pressure applied to the UAW and other unions to renegotiate or fear franchise collapse (cough cough) will increase in intensity and scope. Give away negotiate revised pay levels will be pushed even harder with fewer benefits for the players. Some experienced pros will begin to retire early; their nest eggs being made. What will be left........I leave to your imagination.
In the mean time the league's pocketbook will continue to bleed as it has seen lawsuits double in recent years and there doesn't seem to be any end to the trend ahead soon. Just last year 2,000 ex-players filed a suit regarding head injuries and Junior Seau's family filed suit once he committed suicide after being diagnosed with CTE, a brain disease linked to blows to the head which can result in depression and dementia.
Let's not forget, the players themselves are changing. It seems not a week goes by we don't see a new name splattered across a tabloid headline like a bad nightmare. This isn't your Fathers NFL and the idols seem few and far between; let's just leave it at that.
Lastly America itself is changing to a Honey-Boo-Boo, "setmeupwitharichguy" and gold-digger-baby-daddy reality show nightmare so what's the future of the NFL? I say just throw a couple of fund managers into the Octagon, turn the lights off and go home. How much worse can it get?
Read More, Comment and Share......
Hi there! This a friendly reminder that your StockBuz profile is somewhat *naked* and requires an Avatar.
Come on now.....it only takes 2 minutes to show your style and let the community see what you're all about.
Simply log into http://stockbuz.net
On the top bar, click on Settings.
Click on "Browse" to upload.
Be certain to "Save" at the bottom of the page when done
While you visit, be sure to check out the new sections in our Home page. Options, Macro, Forex and more. We're here to stylize the site to fit your needs. Have a blog or website which you frequent each week? Let us know @ stockbuzsupport@aol.com
We're also encouraging you to let your voice be heard! You don't have to be a Nobel prize winning journalist to have an opinion, a view on the market or investing in general. What steps have you taken to improve your investing? What books, seminars, etc. have had the biggest impact on you and why? What do you believe would reassure Mom & Pop to re-enter the market or are they out for good? Are the Feds actions a help or a hinderance? Have an opinion on the next big bubble? Let us hear it. Post a blog today and be featured in our next newsletter.
We're enjoying some unseasonal warmth here in Texas and I plan on taking full advantage. Hope you enjoy your weekend. I look forward to your new avatar.......come visit us in Chat.
-Kos
Read More, Comment and Share......
Growing in popularity, price matching has become the norm however I see it truly mutating and it's only going to get worse [for margins] if you ask me.
Times were when clipping coupons in the Sunday paper saved you a buck or two with some retailers offering double coupon days and Senior discount days [generally the day before the new ad was to be released] in order to clear old merchandise off the shelf. For those of us struggling to budget with small children, double coupon days at Venture and Zayres was a boon and if there was a Blue Light Special on ham at Kmart, we were there. That was the 70's and inflation was taking a bite out of our pocket.
Evolution slowly lead to price matching between retailers *if* you had a valid ad in hand and your checker called over the Manager for approval who would scrutinize every detail, glasses pulled down to the tip of his nose. This alone guaranteed you a good 5-10 minute wait [mininum], usually with a runny-nosed whining child, impatient at your heels but if you were price matching Fisher Price toys, it was well worth the wait. If a woman ahead of you was price matching, you rolled your eyes and beat feet for another lane. That was the 80s/90s. Jobs were plentiful and the economy was booming.
Fast forward to the 21st century and the post-credit crisis economy and general merchandisers are struggling. Names such as JCPenney have struggled to adapt to the changing consumer and compete with discounters. Target has rushed to compete with the Walmarts and Dollar Generals of the world, scrambling to revamp their store space with groceries and one almost can hear the return of Kmart's Blue Light Special off in the distance as they [and other general merchandisers] struggle to draw in the consumer.
Today numerous grocers:
- Double coupon values on a daily basis [up to a certain value].
- They will also accept more than one coupon on a purchase [many up to four coupons per item].
- Allow coupons to be combined [store coupon + manufacturers coupon].
Websites for "couponers" such as Coupons.com and CouponDivas have grown with lightening speed alerting members to free offers, tutorials on how to become an extreme couponer as well as manufacturer coupons and rebates. There are "coupon installers" online and women have become quite proficient printing multiple coupons and cutting major corners. There are pages on Facebook for couponers and classes offered everywhere where women can learn how to "get it for free".
Even my own daughter has become a crazy couponer posting this on her FB page "I got all of these for free!". Yes, it's viral and it's not going away.
I noticed that back from the dead this year were layaway programs and I'm curious to see how well they fared. Wouldn't be a bit surprised to see this expand further at other retailers as long as growth [and paychecks] remain low.
For certain, the new norm is virtual savings and online coupons which download to a shoppers "smart card" dangling on our key chains with retailers tracking purchases and tracking buying trends. Gasoline savings based on dollars spent at Meijer, Tom Thumb and others, never seen by previous generations. Restaurants have increased their discounting efforts offering buy one-get one free meals. The savings frenzy continues to expand, all to entice to the consumer to keep spending.
It's now commonplace to see women with a handful of ads in the checkout at Walmart price matching anything from chicken to diapers to sneakers. They've evolved with the changing consumers pocketbook and strive to be your one-stop shopping place.
Today Target announced it will now price match online retailers such as Walmart and BestBuy in an effort to be a one-place shop and keep you in the store. Certainly all others will quickly fall in step but what will this mean for margins? Clearly they're adapting to the new, underemployed consumer but I have to wonder how far the rubberband can stretch?
Raise your smart phone, snap a pic and price match your next car. Liquor store price matching online Stoli? Outstanding. Need some bridgework? Your Dentist will match online pricing. Better yet, price match medical services and prescriptions? Bring it.
The overall message is some will adapt and survive in this low growth environment as the world continues to de-leverage and consumers struggle with low paying wages........and others will not. I seriously believe it's going to become more difficult for many retailers margins before it improves. Only one thing is for certain; announce 4x chip days at the casino and I'm there and I'm bringing friends.
Read More, Comment and Share......
A long standing theory of reversals for Technical Analysts, buy [or sell] a break of a third trend line has been around for ages. Also considered by some as the Fan Principle, it allows you to wait for supply and demand to battle it out and jump in when the winner [trend reversal] finally reveals itself.........not to mention with a nice base for support [or resistance].
Very often a consolidation within a trend is considered a "resting period" before another leg down [or up] continues but how can one tell if the trend is truly over? That's when a break of a 3rd trend line comes in handy.
It worked quite well when the U.S. Dollar reversed.
I also utilized the method getting long WLT @ $29.60 [just to name a few]
Now I've been stalking bonds to the short side along with every other market participant after having been long TLT in the Spring of 2011 [now flat] but this chart of TBT has truly piqued my curiosity.
I'll be waiting and watching for a 3rd trend line break and I guarantee you I won't be the only one. *If* TBT remains in its recent range, it will approach it's third trend line juuuust as we will approach the debt ceiling/fiscal cliff extension expiration in a few months. Truly something that makes me go "hmmmmmmmmm"
[Click on chart to enlarge]
Read More, Comment and Share......
Are you a news addict? A market junkie? Are you fully functional to walk away or are you hooked? Do you need the fix on your television every day? Can you make it through the trading day without the bias and noise? Just grab the morning's econ numbers and step away; cold turkey? I triple-dog dare you.
Ignore the plethora of pontificating pundits [or as I call them *smidiots*] chanting that the market is cheap. The CEO's cheerleading for their own product; always painting a rosey future picture [even if they have to change that forecast down the road]. Seriously? Can you say bias? Turn off the clowns whose job is to entertain you as they "educate" and convince you to "buy buy buy!". The *anal*ysts playing tug-o-war, "my way is better" over sectors; each with his own belief system of valuation. P/E is the way to go. No, it's price to cash flow, tangible-book-value, forward earnings vs. TTM [trailing twelve month for you newbies] or whatever justification they can find to convince you and every other viewer just what to do with your hard earned savings and 401k........buy.
THAT is their JOB.......not only keep you informed, but to entertain, keep you in the loop, motivated and energized. You know you need to do something with your money and why would anyone on a syndicated television program lie? You're subconsciously seeking approval. The big "o.k." and you're not alone. Humans have the natural tendency to seek out information that confirms their preconceptions, independently of whether they are true. Confirmation Bias is, after all, a wonderful thing.......or is it? It gives one the illusion of being in control, knowing [or believing in knowing] what's to come.
Traders also have a tendency to follow others trade tweets and blog recommendations. If you've ever played Roulette and watched others place bets on the same numbers as a *hot winner* at the table, that behavior is considered Illusion of Control by Proxy. Believing his knowledge of the game, odds or luck must be superior to yours......so you follow him.
It seems natural that when actively trading, one watches CNBC, Fox Business and Bloomberg for guidance, reassurance.. They, after all, have far more knowledge and insight into the market than you [or me] in what lies ahead. Even if they made mistakes in the past a la Cramer's "Bear Stearns is fine" call, Meredith Whitney's 2010 warning on Muni bonds or Doug Kass's 2010 short bonds call, we give them a mulligan and continue to watch the hype. As we hear news [bad or good], our confirmation bias takes over and we scan the news and blogs as we seek out those who we believe are more informed and/or more experienced. Who we trust.
The bias is the same if you have a negative outlook. Consider: when it comes to Mr. Market, for every buyer there is someone selling. For every analyst on your screen saying your stock [or the overall market for that matter] is sure to head higher, there is another analyst who can justify the opposite. Another ZeroHedge, Dshort or Marc [Dr. Doom] Faber who pounds the table, screaming the market is going to implode [at least that's how it seems]. They appear consumed with attitude polarization for whatever reason and will never be happy no matter what the econ. news. Every headline is fraught with internal weaknesses confirming their negative view.
Somewhere in between there must lie a happy medium.
What would happen if you *didn't* watch them throughout the day? Will the world end? Market implode? Volumes dry up and the stock market as we know it, come to an end; crashing to zero? Will news television cease to exist? Certainly not. The sun will rise tomorrow and money will continue to flow. One thing you will notice.........is your trading improves. Tuning out news television forces you to sit on your hands and look past the glitz and flashing lights, truly focus and invest based on fundamentals, the larger macroeconomic picture and what the charts are telling you.......yes just like the big players.
Maybe, just maybe, it forces you to invest based on your own convictions, your own beliefs. Not based on today's option flow. Not based on a CEO attempting to reassure nervous investors to retain his market capital. Not based on a smidiot who, quite frankly, could care less if he's wrong tomorrow and you lose $500. He's made his millions. He has his contract and a steady job. He tried but he guessed wrong. Oops. All he has to do it appear contrite next week and he'll get another mulligan once again.
Confirmation bias however comes with it's own risks. Anyone remember Lenny Dykstra? Lenny, or Nails [his nickname], was a former Major League Baseball player for the 1986 World Champions, NY Mets and the 1993 National League Champions, Philadelphia Phillies who was called "one of the great ones in this business" by experienced ex-hedge fund Manager Jim Cramer. He was so good, he convinced veteran Wall Streeters he knew his stuff with options strategies so complex that veteran reporters were left confused. So good, he was a guest on CNBC [you mean not all guests are credible?], issued his own newsletter "Nails On the Numbers" and was granted a premium service on theStreet.com with an enormous following, only to go down in flames charged with fraud, theft and more. While some will say Lenny was an anomaly in the business, my point is that thousands every day tune into news television, Twitter and the web for confirmation, guidance and insight. Thousands every day who are watching no more than a dog and pony show............[you're not going to like this] instead of using their brain.
I'm the first to admit that after 25 years in mortgage banking and self-directing my investments, there was still an enormous learning curve when it came to actual trading for myself. Beginning in 2001 wasn't the kindest of all periods during which to make the plunge however it taught me a great deal:
- Don't believe everything you see or hear on television. Some guys were still fighting the trend in 2003 long after the dot.com bubble had burst and 40% of SPX market capitalization had evaporate.
- Learn your moving averages; especially those on longer time frames. Big money buys at 50month, 100month, 150month, etc. levels. Why aren't you?
- Be extremely skeptical of any bearish charts you're given which only reflect a 3-5 year history and patterns. You'll see tops and they'll scream doom and gloom when in actuality, going back over historical charts you'll see the identical patterns over and over and over again and guess what? The market survived! In my mind, any chartist that urges you to invest this way, should be removed from your *trusted* list. Go ahead and read if you wish but make darn certain you're not investing your capital based on "theory" and speculation. Let the charts show you the way.
- Bubbles come to an end.
- Every momentum move eventually loses steam and the market *shifts* in a new direction; seeks out new leadership.
- No one knows it all. There is no "holy grail" of trading. After all if someone has the holy grail, why does he need to sell it to you for $499 with no guaranty?
I've been through the lies, the clowns, the *anal*ysts who were right and wrong. The twitter names who faded into the sunset and others who went subscription only. I had margin calls some mornings and woke up with enormous winners others. I made it through two huge downturns which many weren't so fortunate. I was happy program trading, swing trading and doing my own *thang* but then a fellow trader [yes Ryan Romero, that'd be you] urged me to cut out news television and see the difference.
Once I did [turning it off or muting after the morning's econ news releases were over], things changed dramatically for the better. Before I hit any button, I made certain I wasn't lieing to myself [even if it was against what the pundits were saying], talking myself into a bad trade with high risk. It was no longer trading on emotion because I *might miss out* as the tv *anal*ysts implied. It was trading based on technical levels with a longer hold period and less fees [sorry Mr. broker but my commissions are far less than year - no Pointsetta for me]. As a shameless plug I must also give credit to my fellow StockBuz members as they too, are wonderful at voicing concerns when they thought I was wrong, looking out for one another in seeking he *good* trades and collaborating on just where are the best levels to buy. They do a great job of knocking that little devil on my shoulder saying *buy buy buy!*.......right on to the floor. We've hit some outstanding moves these last few years; not just in momentum stocks but in TLT, UNG [yes!], BRK.B, WAG, the top in Copper, Silver and Gold, ANF, DECK and many, many more. I cannot say enough about the camaraderie and open sharing platform all for a FREE membership. Thank you guys/gals for always having my back.
We luckily also have the internet, with tens of thousands of websites to research with which we can learn, expand our knowledge base and ultimately come to our own conclusions on market direction. News television is no longer the end-all-be-all when it comes to investing and if you feel that it is, Sir you shouldn't be trading.
Getting back to the main subject somewhere, I think the reason I love the market is because you never stop learning. The market is a journey with endless new horizons. Always changing, always shifting, always evolving. It's not that pundits on news television aren't providing a service; they are and for the most part they do their best. It's also not that they should be expected to be 100% correct all of the time but one has to understand that they have a motivation or bias for keeping you glued to the set. It's called job security and they've got a hot winner guaranteed not to lose right after the sponsor-paid-for commercial break.
Read More, Comment and Share......
A discussion in Chat the other day prompted me to pull out some charts to demonstrate visually the points being covered. On this topic Ryan and I agree. Specifically, that seeing a double high in price just isn't enough in our book to call something a double top with any form of confidence when risking my money. Rather I would prefer to see some form of negative divergence in indicators to lead me to believe that the trend is weakening and ready for a reversal.
Now the learned gentlemen @ FreeStockCharts.com lay out some great guidelines in their Chart School on double tops:
- You have to have a prior trend to reverse.
- Volume increase on the breakdown [as they clear out stops] is helpful to confirm.
- Time. I'm also in agreement with them that I prefer to see one to three months elapse in the building of the two peaks. Remember, big money is placing their buy/sell orders based on weekly and daily timeframes. That's not to say that these conditions cannot exist intraday [5/15/60min], but the longer timeframe [daily/weekly] rules the trend of the stock so don't fight the trend.
The thing they don't address and I definitely like to see is negative divergence in MACD, Stoch or some other indicator when the 2nd peak is achieved as a confirmation of weakness in a stock
As an example, MSCC challenged it's high but you'll notice that MACD failed to achieve a new high. That's a negative divergence and it's that divergence that leads me to believe that buying interest in the stock has waned. Warning Will Robinson.......stay away!
Once it breaks support, conventional wisdom will call that prior support area, new resistance however some stocks will once again challenge their high [as MSCC did] and when the stock challenged once again, it would've given one the perfect opportunity to get short with a cover stop above the prior swing high.
Others don't give you that opportunity. The breakdown area serves as solid resistance and buyers simple cannot believe a breakdown is taking place as what happened in PCLN.
The same divergences can also signal head-and-shoulder tops and triangles. Take this example of FDO where there was a divergence as the head was formed.
Observant traders seeing the divergence would've begun to short the stock as it attempted to head higher; thus forming a right shoulders. Eventually the bulls give as the sellers overwhelm. Once support is broken, stops are triggered and the stock corrects.
One of my idols, Thomas Bulkowski, defines double tops as one of the most reliable chart pattern in terms of performance and breaks them down even further in his Encyclopedia of Chart Patterns with a 71-73% success rate. NOTE: Checkout the free PDF version of this fantastic book in our Book forum.
Clearly if properly identified and if accompanied with divergences, these patterns [applicable in the reverse fashion for head-and-shoulder bottoms] are profitable setups for traders..........and flash warning signals for longs as to when to cut the cord and bail out of a position.
Read More, Comment and Share......
 When Microsoft introduces its long-awaited Windows 8 operating system Friday, it will be the first Windows rollout to face real competition since, well, forever. Today, smartphones and tablets do almost all of the day-to-day tasks a PC does -- including sending e-mail, surfing the Web, and editing photos -- and do some of them better. Already, tech investors, long accustomed to a lift from Windows, are primed for disappointment.
At the same time, big data -- massive data centers that can marshall tremendous computing power -- is upending the traditional network, pushing information-processing into the palm of your hand. And it's happening faster than almost anybody expected, as last week's spooky earnings surprises at Microsoft (ticker: MSFT) and chip makers Intel (INTC) and Advanced Micro Devices (AMD) made clear.
So who are the winners and losers in a post-PC world? Apple (AAPL), Google (GOOG), and Samsung Electronics (005930.Korea) certainly stand to gain, and EMC (EMC) will be a winner in the big-data world. Obvious losers include PC makers Hewlett-Packard (HPQ) and Dell (DELL). Intel and Microsoft, which straddle both the PC and post-PC worlds, are tougher calls. Their high dividends and cheap valuations make them hard for investors to rule out.
On-demand computing, which is to say, the cloud, will benefit Amazon.com (AMZN), and Salesforce.com (CRM). And arms merchants to cloud providers, like storage giant EMC (EMC), also will prosper.
There are new challengers, as well. Workday (WDAY), Splunk (SPLK), and Qlick Technologies (QLIK), recent IPOs all, bear watching by investors. Promising startups that have not yet hit the public stage, such as equipment vendor Ruckus Wireless, also could be game-changers down the road.
SEPARATING GOOD INVESTMENT IDEAS from bad, however, isn't as easy as picking winners in the marketplace. Companies such as Salesforce and web-hosting outfit Rackspace Holding (RAX) may be essential to this sea-change, but their valuations are scarily high. Salesforce, at about $149, fetches 99 times fiscal 2013 earnings estimates, while Rackspace, which operates massive data centers for cloud services, trades at 86 times. Are their opportunities really that much greater than those at Apple, which fetches 11 times estimates, or at Microsoft, which trades at 10 times?
Probably not, argues Barron's Roundtable member Fred Hickey, publisher of the High-Tech Strategist. "Companies like Rackspace and Salesforce are classic story stocks," he says, "and it is very dangerous to own such stocks when everything they might produce in the way of earnings and cash flow is already priced in." Also in that boat, he argues, is Amazon.com, which stands to prosper if its Kindle Fire can elbow its way into the tablet computer market. But at 104 times earnings, that's a big if.
The table "Who Wins, Who Loses" sifts through both opportunities and valuation, to find the best bets for investors. Google's earnings flub last week notwithstanding, that company is still on our list of likely winners, which are few and far between.
IT'S A WHOLE NEW WORLD FOR Microsoft. Smartphones were still relatively primitive when Windows 7 was introduced in 2009, and tablet computers didn't even exist. Now, as the charts "Game On!" illustrate, they threaten the PC hegemony. Neither Microsoft, HP, nor Dell is a force in smartphones or tablets.
"It is becoming a mainstream idea that your PC is not the center of everything," says Kevin Landis of Firsthand Funds, who has owned Microsoft, off and on, for years -- and is nervous every time he does.
That said, Microsoft is putting its vast resources behind its Windows 8 operating system for phones and tablets. And at 12 a.m. Friday, it will begin selling a tablet computer of its own, known as the Surface, setting up a midnight madness event. So we'll know soon how the excitement stacks up against iPhone and iPad madness.
On Thursday, Microsoft reported flat year-over-year revenue, led by a 9% drop in the division that contains Windows. The numbers included pre-sales for Windows 8. Excluding them, sales in the Windows unit dropped by a third. At nine times next year's expected profits, Microsoft shares are very inexpensive, considering the strengths of the company's other businesses, including server software, databases, and collaboration. But unless Microsoft can show that Surface and all the other Win 8 devices will turn the tide for that part of the division, its stock will continue to suffer. Microsoft closed the week at $28.64 and yields 3.2%. (For more on last week's earnings mishaps at Microsoft, Google, and AMD, see Tech Trader.)
THE INEXORABLE SHIFT AWAY from PCs is causing havoc for manufacturers. This year, worldwide sales of personal computers are projected to drop about 2%, to 357 million units, according to IDC's David Daoud. In dollars, they will fall 5% to 6%. More telling: Smartphone sales are expected to surge 42% this year, to $294 billion, topping PC sales for the first time. And sales of tablets are expected to rocket 65%, to $59 billion.
To Dan Niles of Alpha One Capital Partners, this sounds very familiar. He worked in the 1980s at minicomputer titan Digital Equipment Corp., whose founder, Ken Olsen, famously said there was no reason anyone would want a computer in his home. DEC was later acquired by Compaq Computer and vanished without a trace.
Smartphones and tablets are similarly underestimated now, Niles asserts. For that reason, he's inclined to avoid Intel and Microsoft. "Go ahead, gamble they can make the leap to this new world," he s ays. "I don't want that bet."
As the PC market fades, Intel is trying to maintain its lead in server chips, while becoming a force in phones and tablets. Last week, it reported that PC growth had slowed last quarter and this quarter to half its usual seasonal rate, disappointing investors waiting for spiffy new "ultrabook" laptops to make a splash. At the same time, CEO Paul Otellini said Intel's new Atom chip would be in 20 tablets this quarter, including the Surface.
The problem is that Intel has more to lose from the PC decline than to gain from selling cheaper chips for tablets and smartphones. The company's shares, which closed the week at $21.27, trade at nine times next year's estimates and pay a rich 4% dividend. While Intel may never be a growth company again, it probably won't hurt investors who own it.
Apple, trading at 9.1 times this year's projected profits, after backing out $117 billion in cash and investments, is priced quite reasonably, given its expected 24% growth in revenue this year. Even as one of the world's dominant phone makers, it has just 7% of the mobile-phone market, according to Gartner, giving it ample room to grow.
Samsung, the dominant global phone producer, shows no sign of stopping its gains at the expense of smaller companies. Its stock is also undemanding, at 7.5 times next year's earnings' estimate. The Korean-listed shares traded Friday at 1.302 million won, about $1,200; its unsponsored American depositary receipts are thinly traded.
THE OTHER SIDE OF THE POST-PC world is the cloud. On route 101 in Silicon Valley, Wal-Mart has posted signs reading "WALMART DATA," offering jobs to engineers in its San Bruno labs. That's a sign of just how mainstream it's become for companies to sift through enormous amounts of information.
Wal-Mart's quest, and others like it, are changing the very nature of data, says Paul Saffo, a tech pundit who runs Discern Analytics, a big-data outfit in Silicon Valley.
Big data ultimately will redefine the database. To track customer information and behavior in real time, and to respond to it instantaneously, companies are turning increasingly to databases that put information in the random-access memory chips of a computer, rather than on the disk drive, as has been done traditionally. Database-giant Oracle (ORCL) is fending off new competition from SAP (SAP), which sells just such an "in-memory" database. And start-ups also are targeting the database market. Among them: MemSQL, a Silicon Valley company started by former Facebook engineers.

For the moment, Oracle's traditional databases are benefiting from the surge, but that could change by this time next year.
Google is a player par excellence in big data. Sales of smartphones using the Android OS don't make the company any money upfront—it doesn't charge for use of the system -- but ultimately, all the activity on those phones is sending back to Google real-time data from the world that makes its searches more valuable to advertisers.
Google CEO Larry Page said on last week's call that the company was on pace to generate $8 billion a year from mobile devices. And some day, Google's self-driving car will bring the company real-time readings of traffic conditions -- another way to feed Google's rapacious appetite for big data.
And what of Facebook (FB), which, like Google, is building its own computers from scratch to redesign the data center? Facebook defenders take a typical Silicon Valley attitude, trusting it will try a number of ways to monetize the increasing use of mobile technology and eventually hit on a solution. Firsthand's Landis, who's owned the stock since before its IPO and confesses that he's sitting on a loss, says, "Even if they hit one out of 10 products right, that's enough."
Maybe so. But all of that experimentation could cause the company to step up spending next year, says Loomis Sayles tech analyst Tony Ursillo, who also co-manages the Saratoga Advantage Trust Technology and Communications Portfolio. And that could shock the Street, which is projecting roughly flat operating margins for the company.
Amazon.com is one of the most striking players in the post-PC world. Its Kindle Fire, starting at $159, is a truncated tablet -- little more than a means for users to feed at the Amazon trough. Two weeks ago, CEO Jeff Bezos told the BBC that the company breaks even on the hardware, preferring to "make money when people use our devices, not when people buy our devices."
Amazon has overcome many doubters over the years, but with a triple-digit P/E ratio, there's still a lot of doubt to overcome.
Salesforce.com is another cloud company with a heart-stopping valuation, trading at 40 times trailing cash flow. Salesforce has new competition, in the form of Workday, which went public Oct. 12 and popped nearly 70% out of the gate. While Salesforce's software for managing customer relations is important, Workday's focus on human resources—benefits and payroll administration -- is perceived as far more critical to companies.
Hickey predicts that Workday could lure away some Salesforce investors, calling it "the real deal" in cloud computing. But Workday is projected to lose money through fiscal 2015.
EMC is a less expensive way to play the cloud, says Ben Reitzes of Barclays Capital. "EMC's focus is on the hybrid cloud," he says. It has products that help enterprises shift parts of their data-processing into the cloud, reaping greater efficiencies, while maintaining full control of their critical data.
Another company to watch is Ruckus Wireless, which makes equipment that helps carriers offload cellular traffic onto public Wi-Fi hotspots. That is important because the faster connections of the latest smartphones and tablets will cause a surge in bandwidth usage, taxing the precious spectrum. Craig Mathias with Farpoint Group calls CEO Selina Lo "one of the smartest people I know" and a skilled entrepreneur. Ruckus recently filed documents for an initial stock offering.
AS THIS FATEFUL YEAR for the personal computer grinds on, some investors probably will bottom-fish for stocks. One that might be worth a look is Seagate Technology (STX), which trades at four times next year's earnings, less than one times sales, and pays a 4.6% dividend. Seagate has a chance to shift from the PC world to the post-PC world, by selling devices for the cloud and tablets. Unlike HP, which has a similarly cheap valuation, Seagate has a strategy for this and the means to implement it.
A factor that's important for all technology stocks is what happens after November's elections. Any progress on tax policy could unleash massive amounts of cash held by tech companies overseas. That, says Paul Wick, portfolio manager of Columbia Seligman Communications & Information fund, could lead to increased share buybacks and higher dividends. It could also encourage mergers and acquisitions, putting some beaten-down names in play.
But unless that happens, expect PC names to struggle as they adjust to a world in which smartphones and tablets are increasingly seen by consumers as capable of providing most, if not all, of the computing power they need.
In short, the traditional economic engine of the personal computer has broken down, and it's unlikely to get back in gear.
Originally posted @ http://online.barrons.com/article/SB50001424053111904034104578058751530288678.html?mod=BOL_hpp_cover#articleTabs_article%3D3
Read More, Comment and Share......
Seven Varieties of Deflation
Inflation in the U.S. has historically been a wartime phenomenon, including not only shooting wars but also the Cold War and the War on Poverty. That's when the federal government vastly overspends its income on top of a robust private economy—obviously not the case today when government stimulus isn't even offsetting private sector weakness. Deflation reigns in peacetime, and I think it is again, with the end of the Iraq engagement and as the unwinding of Afghanistan expenditures further reduce military spending.
Chronic Deflation
Few agree with my forecast of chronic deflation. They've never seen anything but inflation in their business careers or lifetimes, so they think that's the way God made the world. Few can remember much about the 1930s, the last time deflation reigned. Furthermore, we all tend to have inflation biases. When we pay higher prices, it's because of the inflation devil himself, but lower prices are a result of our smart shopping and bargaining skills. Furthermore, we don't calculate the quality-adjusted price declines that result from technological improvements in many big-ticket purchases. This is especially true since many of those items, like TVs, are bought so infrequently that we have no idea what we paid for the last one. But we sure remember the cost of gasoline on the last fill-up a week ago.
Doubts
Furthermore, many believe widespread deflation is impossible and that rampant inflation is assured in future years because of continuing high federal deficits, regardless of any long-run budget reform. And annual deficits of over $1 trillion are likely to persist in the remaining five to seven years of deleveraging, as I explain in my recent book, The Age of Deleveraging. The 2% annual real GDP growth I see persisting is well below the 3.3% needed to keep the unemployment rate stable. So to prevent high and chronically rising unemployment, any Administration and Congress—left, right or center—will be forced to spend a lot of money to create a lot of jobs.
But big federal deficits are inflationary only when they come on top of fully-employed economies and create excess demand. That's obviously not true at present when large deficits are reactions to private sector weakness that has slashed tax revenues and encouraged deficit spending. Indeed, the slack in the economy in the face of persistent trillion dollar-plus deficits measures the huge size and scope of the offsetting deleveraging in the private sector, as noted earlier.
The deleveraging, especially in the global financial sector and among U.S. consumers, will be completed in another five to seven years at the rate it is progressing. At that point, the federal deficit should fade quickly, assuming a war or other cause of oversized government spending doesn't intervene. The resumption of meaningful economic growth will reduce the pressure for economic stimuli and rising incomes and corporate profits will spur revenues. Serious work on the postwar baby-related bulge in Social Security and Medicare costs will also depress the deficit.
Good Deflation
A decade ago in my two Deflation books, I distinguished between two types of deflation—the Good Deflation of excess supply and the Bad Deflation of deficient demand. Good Deflation is the result of important new technologies that spike productivity and output even as the economy grows rapidly. Bad Deflation results from financial crises and deep recession, which hype unemployment and depress demand.
I've been forecasting chronic good deflation of excess supply because of today's convergence of many significant productivity-soaked technologies such as semiconductors, computers, the Internet, telecom and biotech that should hype output. Ditto for the globalization of production and the other deflationary forces I've been discussing since I wrote the two Deflation books and The Age of Deleveraging. As a result of rapid productivity growth, fewer and fewer man-hours are needed to produce goods and services. The rapid productivity growth so far this decade is likely to persist (Chart 1).
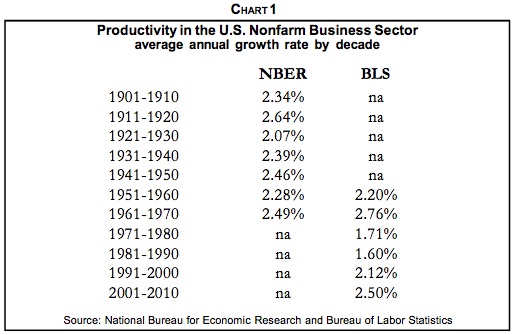
While I've consistently predicted the good deflation of excess supply, I said clearly that the bad deflation of deficient demand could occur—due to severe and widespread financial crises or due to global protectionism. Both are now clear threats.
My forecast is that the unfolding global slump will initiate worldwide chronic deflation. A number of indicators point in that direction. Sure, much of the recent weakness in the PPI and CPI has been due to falling energy and food prices. Excluding these volatile items, prices are still rising but at slowing rates (Charts 2 and 3). Consumer price inflation is also falling abroad in the U.K. and the eurozone.
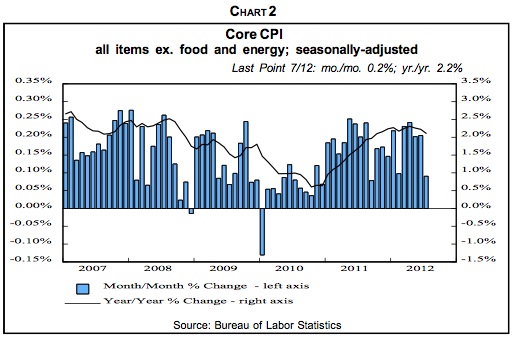
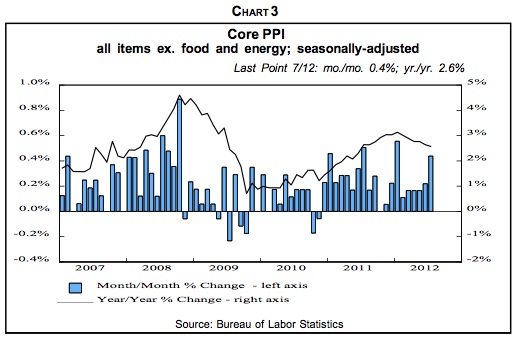
After China's huge stimulus program in 2009 in response to the global recession and nosedive in exports to U.S. consumers, the economy revived, but so did inflation. Double-digit food price jumps were especially troublesome in a land where many live at subsistence levels. So in response to the surge in inflation and the real estate bubble, Chinese leaders tightened economic policy, driving down CPI inflation to a 2.0% rise in August vs. a year earlier. But, in conjunction with the weakening in export growth, that is pushing China toward a hard landing of 5% to 6% economic growth, well below the 7% to 8% needed to maintain stability.
Back in the States, inflationary expectations, as measured by the spread between 10-year Treasury yields and the yield on comparable Treasury Inflation-Protected Securities are narrowing.
Other Varieties
Besides rises or falls in general price levels, which most think about when they hear "inflation" or "deflation," there are six other varieties, maybe more.
Commodity Inflation/Deflation. In the late 1960s, the mushrooming costs of the Vietnam War and the Great Society programs in an already-robust economy created a tremendous gap between supply and demand in many areas. The history of low inflation rates for goods and services, we'll call it CPI inflation for short, in the late 1950s and early 1960s, apparently created a momentum of low price advances that kept CPI inflation from exploding until about 1973. But by the early 1970s, commodity prices started to leap and spawned a self-feeding up surge. Worried that they'd run out of critical materials in a robust economy, producers started to double and triple order supplies to insure adequate inventories. That hyped demand, which squeezed supply, and prices spiked further. That spawned even more frenzied buying as many expected shortages to last forever.
At the time, even before the 1973 oil embargo, I was lucky enough to realize that what was occurring was not perennial shortages but massive inventory-building. I found a parallel in post-World War I when wartime price and wage controls were removed and wholesale prices skyrocketed about 30% in one year as double and triple ordering hyped inventories amid frenzied demand and fears of shortages. Then all those inventories arrived and sired the 1920-1921 recession, the sharpest on record, and wholesale prices collapsed. Armed with this history, I correctly forecast the 1973-1975 recession and said it would be the worst since the 1930s, which it proved to be. Arriving inventories swamped production, especially in late 1974 and early 1975, so production nosedived.
Another Commodity Bubble
It's probably no coincidence that China's joining the World Trade Organization at the end of 2001 was followed by the commencement of another global commodity price bubble that started in early 2002 (Chart 4). And it has been a bubble, in my judgment, based on the conviction that China would continue to absorb huge shares of the world's industrial and agricultural commodities. The shift of global manufacturing toward China magnified her commodity usage as, for example, iron ore that previously was processed into steel in the U.S. or Europe was sent to China instead.
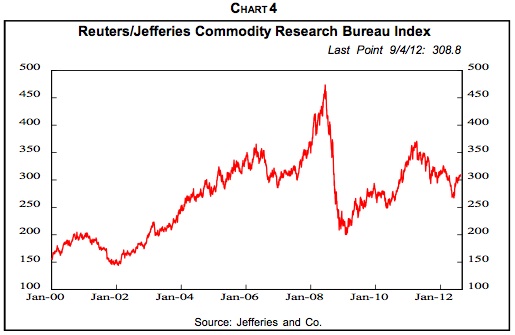
Peak Oil
Crude oil has been the darling of the commodity-shortage crowd, and when its price rose to $145 per barrel in July 2008, many became convinced that the world would soon run out of oil.
But they discounted the fact that reserves are often underestimated since oil fields produce more than original conservative estimates. Nor did they expect conventional and shale natural gas, liquefied natural gas, the oil sands in Canada, heavy oil in Venezuela and elsewhere, oil shale, coal, hydroelectric power, nuclear energy, wind, geothermic, solar, tidal, ethanol and biomass energy, fuel cells, etc. to substitute significantly for petroleum.
Recent Weakness
The weakness in commodity prices, starting in early 2011, no doubt has been anticipating both a hard landing in China and a global recession. In my view, the foundation of the decade-long commodity bubble is crumbling, and the unfolding of a hard landing in China and worldwide recession will depress commodity prices considerably, even from current levels, as disillusionment replaces investor enthusiasm.
Wage-Price Inflation/Deflation. A second variety of inflation is a particularly virulent form, wage-price inflation in which wages push up prices, which then push up wages in a self-reinforcing cycle that can get deeply and stubbornly embedded in the economy. This, too, was suffered in the 1970s and accompanied slow growth. Hence the name, stagflation. As with commodity inflation, it was spawned by excess aggregate demand resulting from huge spending and the Vietnam War and Great Society programs on top of a robust economy.
Back then, labor unions had considerable bargaining strength and membership. Furthermore, American business was relatively paternalist, with many business leaders convinced they had a moral duty to keep their employees at least abreast of inflation. Most didn't realize that, as a result, inflation was very effectively transferring their profits to labor. And also to government, which taxed underdepreciation and inventory profits. The result was a collapse in corporate profits' share of national income and a comparable rise in the share going to employee compensation from the mid-1960s until the early 1980s.
The Peak
The wage-price spiral peaked in the early 1980s as CPI inflation began a downtrend that has continued. Voters rebelled against Washington, elected Ronald Reagan and initiated an era of government retrenchment. The percentage of Americans who depend in a significant way on income from government rose from 28.7% in 1950 to 61.2% in 1980, but then fell to 53.7% in 2000. Furthermore, the Fed, under then-Chairman Paul Volcker, blasted up interest rates, and negative real borrowing costs turned to very high positive levels.
As inflation receded, American business found itself naked as the proverbial jaybird with depressed profits and intense foreign competition. In response, corporate leaders turned to restructuring with a will. That included the end of paternalism towards employees as executives realized they were in a globalized atmosphere of excess supply of almost everything. With operations and jobs moving to cheaper locations offshore and with the economy increasingly high tech and service oriented, union membership and power plummeted, especially in the private sector.
In today's unfolding deflation, the wage-price spiral has been reversed. Contrary to most forecaster expectations, but forecast in my two Deflation books, wages are actually being cut and involuntary furloughs instituted for the first time since the 1930s. In inflation, oversized wages can be cut to size by simply avoiding pay hikes while inflation erodes real compensation to the proper level. But with deflation, actual cuts in nominal pay are necessary. Note that as wage cuts and furloughs become increasingly prevalent, the layoff (Chart 5) and unemployment numbers (Chart 6) will increasingly understate the reality of the declines in labor compensation.
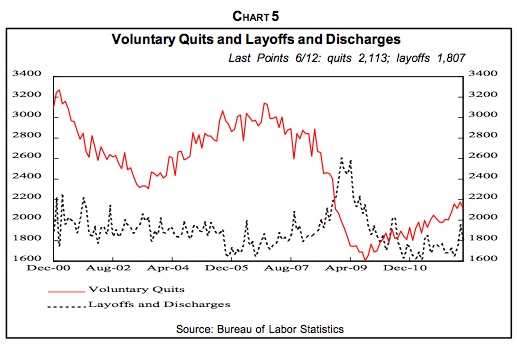
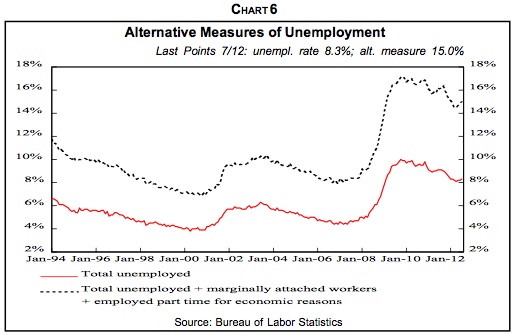
Financial Asset Inflation/Deflation. Perhaps the best recent example of financial asset inflation was the dot com blowoff in the late 1990s. It culminated the long secular bull market that started in 1982 and was driven by the convergence of a number of stimulative factors. CPI inflation peaked in 1980 and declined throughout the 1980s and 1990s. That pushed down interest rates and pushed up P/Es. American business restructured and productivity leaped.
A Secular Down Cycle
The robust economy upswing that drove the 1982-2000 secular bull market ended in 2000, as shown by basic measures of the economy's health. Stocks, which gauge economic health as well as fundamental sentiment, have been trending down since 2000 in real terms (Chart 7). At the rate that deleveraging worldwide is progressing, it will take another five to seven years to be completed with equity prices continuing weak on balance during that time. Employment also peaked out in 2000 even after accounting for lower although rising labor participation rates by older Americans. Household net worth in relation to disposable (after-tax) income has also been weak for a decade.
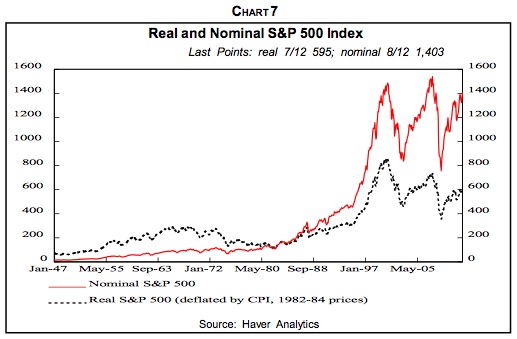
The Federal Reserve's Survey of Consumer Finances, just published for 2007-2010, reveals that median net worth of families fell 39% in those years from $126,400 to $77,300, largely due to the collapse in house prices. Average household income fell 11% from $88,300 to $78,500 in those years with the middle-class hit the hardest. The top 10% by net worth had a 1.4% drop in median income, the lowest quartile lost 3.7% but the second quartile was down 12.1% and the third quartile dropped 7.7%.
Households reacted to too much debt by reducing it. In 2010, 75% of households had some debt, down from 77% in 2007, according to the Fed survey. Those with credit card balances fell from 46.1% to 39.4% but late debt payments were reported by 10.8% of households, up from 7.1% in 2007. With house prices collapsing, debt as a percentage of assets climbed to 16.4% in 2010 from 14.8% in 2007. Financial strains reduced the percentage that saved in the preceding year from 56.4% in 2007 to 52% in 2010.
Nevertheless, the gigantic policy ease in Washington in response to the stock market collapse and 9/11 gave the illusion that all was well and that the growth trend had resumed. The Fed rapidly cut its target rate from 6.5% to 1% and held it there for 12 months to provide more-than ample monetary stimulus. Meanwhile, federal tax rebates and repeated tax cuts generated oceans of fiscal stimulus as did spending on homeland security, Afghanistan and then Iraq.
As a result, the speculative investment climate spawned by the dot com nonsense survived. It simply shifted from stocks to commodities, foreign currencies, emerging market equities and debt, hedge funds, private equity—and especially to housing. Homeownership additionally benefited from low mortgage rates, loose lending practices, securitization of mortgages, government programs to encourage home ownership and especially to the conviction that house prices would never fall.
Investors still believed they deserved double-digit returns each and every year, and if stocks no longer did the job, other investment vehicles would. This prolongs what I have dubbed the Great Disconnect between the real world of goods and services and the speculative world of financial assets.
Treasurys
I hope you'll recall my audacious forecast of 2.5% yields on 30-year Treasury bonds and 1.5% on 10-year Treasury notes, made at the end of last year when the 30-year yield was 3.0%. Those levels were actually reached recently (Chart 8), and I now believe the yields will fall to 2.0% and 1.0%, respectively, for the same reasons that inspired my earlier forecasts. The global recession will attract money to Treasurys as will deflation and their safe-haven status. Sure, Treasurys were downgraded by Standard & Poor's last year, but in the global setting, they're the best of a bad lot.
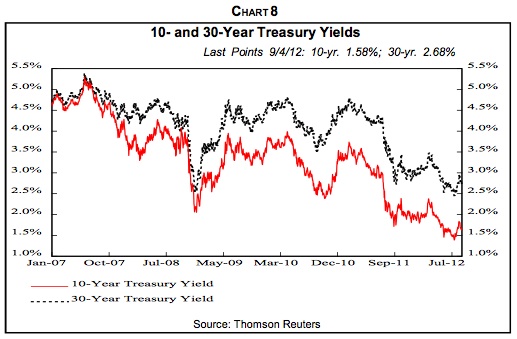
The deflation in interest rates has spawned significant side effects. It's a zeal for yield that has pushed many individual and institutional investors further out on the risk spectrum than they may realize. Witness the rush into junk bonds and emerging country debt. Recently, investors have jumped into the government bonds of Eastern European countries such as Poland, Hungary and Turkey where yields are much higher than in developed lands. The yield on 10-year notes in Turkish lira is about 8% compared to 1.4% in Germany and 1.6% in the U.S.
The inflows of foreign money has pushed up the value of those countries' currencies, adding to foreign investor returns. And some of these economies look solid relative to the troubled eurozone—Poland avoided recession in the 2008-2009 global financial crisis. But the continuing eurozone financial woes and recession may well drag the zone's Eastern European trading partners down. And then, as foreign investors flee and their central banks cut rates, their currencies will nosedive much as occurred in Brazil.
Tangible Asset Inflation/Deflation. Booms and busts in tangible asset prices are a fourth form of inflation/deflation. The big inflation in commercial real estate in the early 1980s was spurred by very beneficial tax law changes earlier in the decade and by financial deregulation that allowed naïve savings and loans to make commercial real estate loans for the first time. But deflation set in during the decade due to overbuilding and the 1986 tax law constrictions. Bad loans mounted and the S&L industry, which had belatedly entered commercial real estate financing, went bust and had to be bailed out by taxpayers through the Resolution Trust Corp.
Nonresidential structures, along with other real estate, were hard hit by the Great Recession and remain weak as capacity remains ample and prices of commercial real estate generally persist well below the 2007 peak. The two obvious exceptions are rental apartments and medical office buildings. Returns on property investments recovered from the 2007-2009 collapse, but are now slipping.
Retail vacancy rates remain high (Chart 9) due to cautious consumers and growing online sales. Rents remain about flat. Ditto for office vacancies due to weak employment and the tendency of employers to move in the partitions to pack more people into smaller office spaces. The office vacancy rate in the second quarter was 17.2%, the same as the first quarter, down slightly from the post-financial crisis peak of 17.6% in the third quarter of 2010 but well above the 2007 boom level of 13.8%. In the second quarter, office space occupancy rose just 0.12% from the previous quarter compared to 0.18% in the first quarter.
Housing Woes
House prices have been deflating for six years, with more to go (Chart 10). The earlier housing boom was driven by ample loans and low interest rates, loose and almost non-existent lending standards, securitization of mortgages which passed seemingly creditworthy but in reality toxic assets on to often unsuspecting buyers, and most of all, by the conviction that house prices never decline.
I expect another 20% decline in single-family median house prices and, consequently, big problems in residential mortgages and related construction loans. In making the case for continuing housing weakness, I've persistently hammered home the ongoing negative effect of excess inventories on house sales, prices, new construction and just about every other aspect of residential real estate.
Spreading Effects
That further drop would have devastating effects. The average homeowner with a mortgage has already seen his equity drop from almost 50% in the early 1980s to 20.5% due to home equity withdrawal and falling prices. Another 20% price decline would push homeowner equity into single digits with few mortgagors having any appreciable equity left. It also would boost the percentage of mortgages that are under water, i.e., with mortgage principals that exceed the house's value, from the current 24% to 40%, according to my calculations. The negative effects on consumer spending would be substantial. So would the negative effects on household net worth, which already, in relation to after-tax income, is lower than in the 1950s.
Currency inflation/deflation. We all normally talk about currency devaluation or appreciation. This is, however, another type of inflation/deflation and like all the others, it has widespread ramifications. Relative currency values are influenced by differing monetary and fiscal policies, CPI inflation/deflation rates, interest rates, economic growth rates, import and export markets, safe haven attractiveness, capital and financial investment opportunities, attractiveness as trading currencies, and government interventions and jawboning, among other factors. In recent years, Japan, South Korea, China and Switzerland have all acted to keep their currencies from rising to support their exports and limit imports.
The U.S. dollar has been strong of late, resulting from its safe haven status in the global financial crisis. Furthermore, the U.S. economy, while slipping, is in better shape than almost any other—the best of the bunch. I believe the global recession will persist and the greenback will continue to serve this role. Furthermore, the greenback is likely to remain strong against other currencies for years as it continues to be the primary international trading and reserve currency. The dollar should continue to meet at least five of my six criteria for being the dominant global currency:
1. After deleveraging is complete, the U.S. will return to rapid growth in the economy and in GDP per capita, driven by robust productivity.
2. The American economy is large and likely to remain the world's biggest for decades.
3. The U.S. has deep and broad financial markets.
4. America has free and open financial markets and economy.
5. No likely substitute for the dollar on the global stage is in sight.
6. Credibility in the buck has been in decline since 1985, but may revive if long-run government deficits are addressed and consumer retrenchment and other factors shrink the foreign trade and current account deficits.
Inflation By Fiat. Way back in 1977, I developed the Inflation by Fiat concept, which gained media attention in that era of high wage-price inflation. This seventh form of inflation encompassed all those ways by which, with the stroke of a pen, Congress, the Administration and regulators raise prices.
The continual rises in the minimum wage is a case in point. So, too, are high tariffs on imported Chinese tires. Agricultural price supports keep prices above equilibrium. As a result, the producer price of sugar in the U.S. is 28 cents per pound compared to the 19 cents world price. Federal contractors are required to pay union wages, which almost always exceed nonunion pay, as noted earlier, another example of inflation by fiat.
Environmental protection regulations may improve the climate, but they increase costs that tend to be passed on in higher prices. The Administration says its new fuel-economy standards of 54.5 miles per gallon by 2025 will cost $1,800 per vehicle but industry estimates put it at $3,000. The cap and trade proposal to reduce carbon emissions is estimated to cost each American household $1,600 per year, according to the Congressional Budget Office. Pay hikes for government workers must be paid in higher taxes sooner or later, and can spill over into private wage increases—although state and local government employee pay is moving back toward private levels, as discussed earlier. Increases in Social Security taxes raise employer costs, which they try to pass on in higher selling prices.
There was some deflation by fiat in the 1980s and 1990s. One of the biggest changes was requiring welfare recipients to work or be in job-training programs. That reduced the welfare rolls from 4.7% of the population in 1980 to 2.1% in 2000, while the overall number that depended on government for meaningful income dropped from 61.2% to 53.7%. But now, as an angry nation and left-leaning Congress and Administration react to the financial collapse, Wall Street misdeeds and the worst recession since the Great Depression, the increases in government regulation and involvement in the economy have been substantial. And with them, more inflation by fiat—at least unless there is a major change of government control with the November elections.
(Excerpted from Gary Shilling's INSIGHT newsletter. For more information, visit www.agaryshilling.com)
Read More, Comment and Share......
[Edited October 15, 2012 to add Reuters link and Citicorp PDF ]
Natty outperform black gold? Texas tea? Yes it's happening and the intriguing part is it could continue. It's unimaginable, unheard of, pure heresy but it at the same time, appears to be the Captain Obvious trade to these novice aging eyes. While I'm no guru and don't begin to know it's intricacies, allow me to explain from a technical analysis and common sense point of view. [CLICK ON ANY CHART TO ENLARGE]
#1 Falling crude oil demand in developed countries continues and this decline is expected to continue going forward......while increasing demand is expected in developing countries however I doubt quite a rapid increase given the status of global economies at this point in time. Main point however, is that the U.S. itself is not expecting to increase its demand any time soon.
On a side note, the EIA expects more U.S. homes to use more heating fuels this Winter. [See report] BP, Shell and others are pushing hard to export overseas [Reuters]
#2 The push for American independence from foreign oil. Now before you roll your eyes thinking this is a political pitch, I'm merely pointing out the obvious with nonpartisan facts that can easily be found at the Baker Hughs website. While prior administrations have all *touted* they were for pushing for this initiative, only in the last four years have we actually *seen* a change in U.S. oil rig counts, increasing 4x from prior levels. That, my friends, is a definite step in the right direction [imo].
In February 2012 Citigroup acknowledged the enormous expansion of new US crude oil supply thanks to North Dakota and announced The Death of the Peak Oil Hypothesis and that this excess supply will apply future downward pressure on crude pricing.
#3 Now for some simple common sense. I'm certain the big boys would love to push crude's pricing to test the 2008 highs [and they will one day] but given not only the fragile U.S. economy, but slowing in every other global economy, I don't see how anyone with half a brain is going to risk pushing the consumer off a ledge with higher gasoline pricing. After all, anything over $4/gal. begins to weigh on the economy. Additionally historic crude oil spikes have been proven to be followed by economic recessions [see research data here] so let's just take the idea of higher crude oil [minus any temporary spikes due to Middle East tensions] off the table. So how's a poor oil baron to make a buck? Why by letting natty have it's day in the sun of course!
#4 So let's lower the # of natural gas rigs [red], tightening supply, and increase the crude oil rigs [blue].
Fewer rigs = less supply
Interestingly enough, the EIA has predicted that the US will become a net-exporter of natural gas as well. Nice! [See report]
Then let's take a look and see if Mr. Stockmarket is confirming my thesis.
On a daily basis I usually view heavy volume as a sign of selling, however on a longer time frame [monthly] you can see where USO was experiencing enormous volume on dips prior to it's enormous run up. Short covering and accumulation on a large scale. Big players can then sit back and unload gradually over time.
*Now* we see the same huge volume in the nat. gas ETF, UNG but does that alone mean anything? Let's look further.
IN futures we see that Natural Gas futures [/NG] are in Contango with future contracts pricing higher than the current. Translation: higher forward prices are an indication of expectations of supply tightening; hence the higher forward price.......and this is the first time in YEARS that this has been the case.
How about seasonal demand? It begins to creep up in September anticipating colder temperatures. A warmer-than-normal Winter such as we saw last year would hamper demand however Minneapolis MN received 2-1/2 feet of snow just last week [!] so one can only wait and see. Hope for cold temps folks.
Next we examine a chart of the "Widowmaker" UNG, which for years took everyone and anyone's money who tried to get long as Natty. Reason being is that nat gas had an ever-increasing excess supply causing "backwardation" [lower forward pricing] and since UNG quite often recalculates based on the next months contract [which was lower in price], any long buyer was basically swimming against the current like a Salmon going upstream [but they have more success]. Now that natty is "Contango", forward contracts are higher, helping UNG with a boost as it re-balances. fwiw we were watching natty this Summer in Chat and had a buy signal @ $16.00!
Lastly, I compared the performance of USO to UNG and not only is natty outperforming, it broke major support in the USO/UNG ratio. In my mind, this is significant. I'd like to see a correction on a weekly time frame to test $17 support but for now, my bet is nat gas will continue to outperform black gold for the near term. Come on Winter!
Clearly I am more of a t/a trader than a long term, fundamental investor therefore I urge you to do your own diligence. I currently have no position in UNG, USO, nat. gas or crude oil futures nor do I intend on establishing one within the next 72 hours.
Read More, Comment and Share......
