Opinion (181)

Admin

Will Credit Cause A Slowdown

Saxo Bank thinks a slowdown in credit growth is bad news

20170909_BLP518.jpg?width=500

IF THERE is a consensus at the moment, it is that the global economy is finally managing a synchronised recovery. The purchasing managers' index for global manufacturing is at its highest level for six years; copper, the metal often seen as the most sensitive to global conditions, is up by a quarter since May

20170916_woc638_0.png?width=450
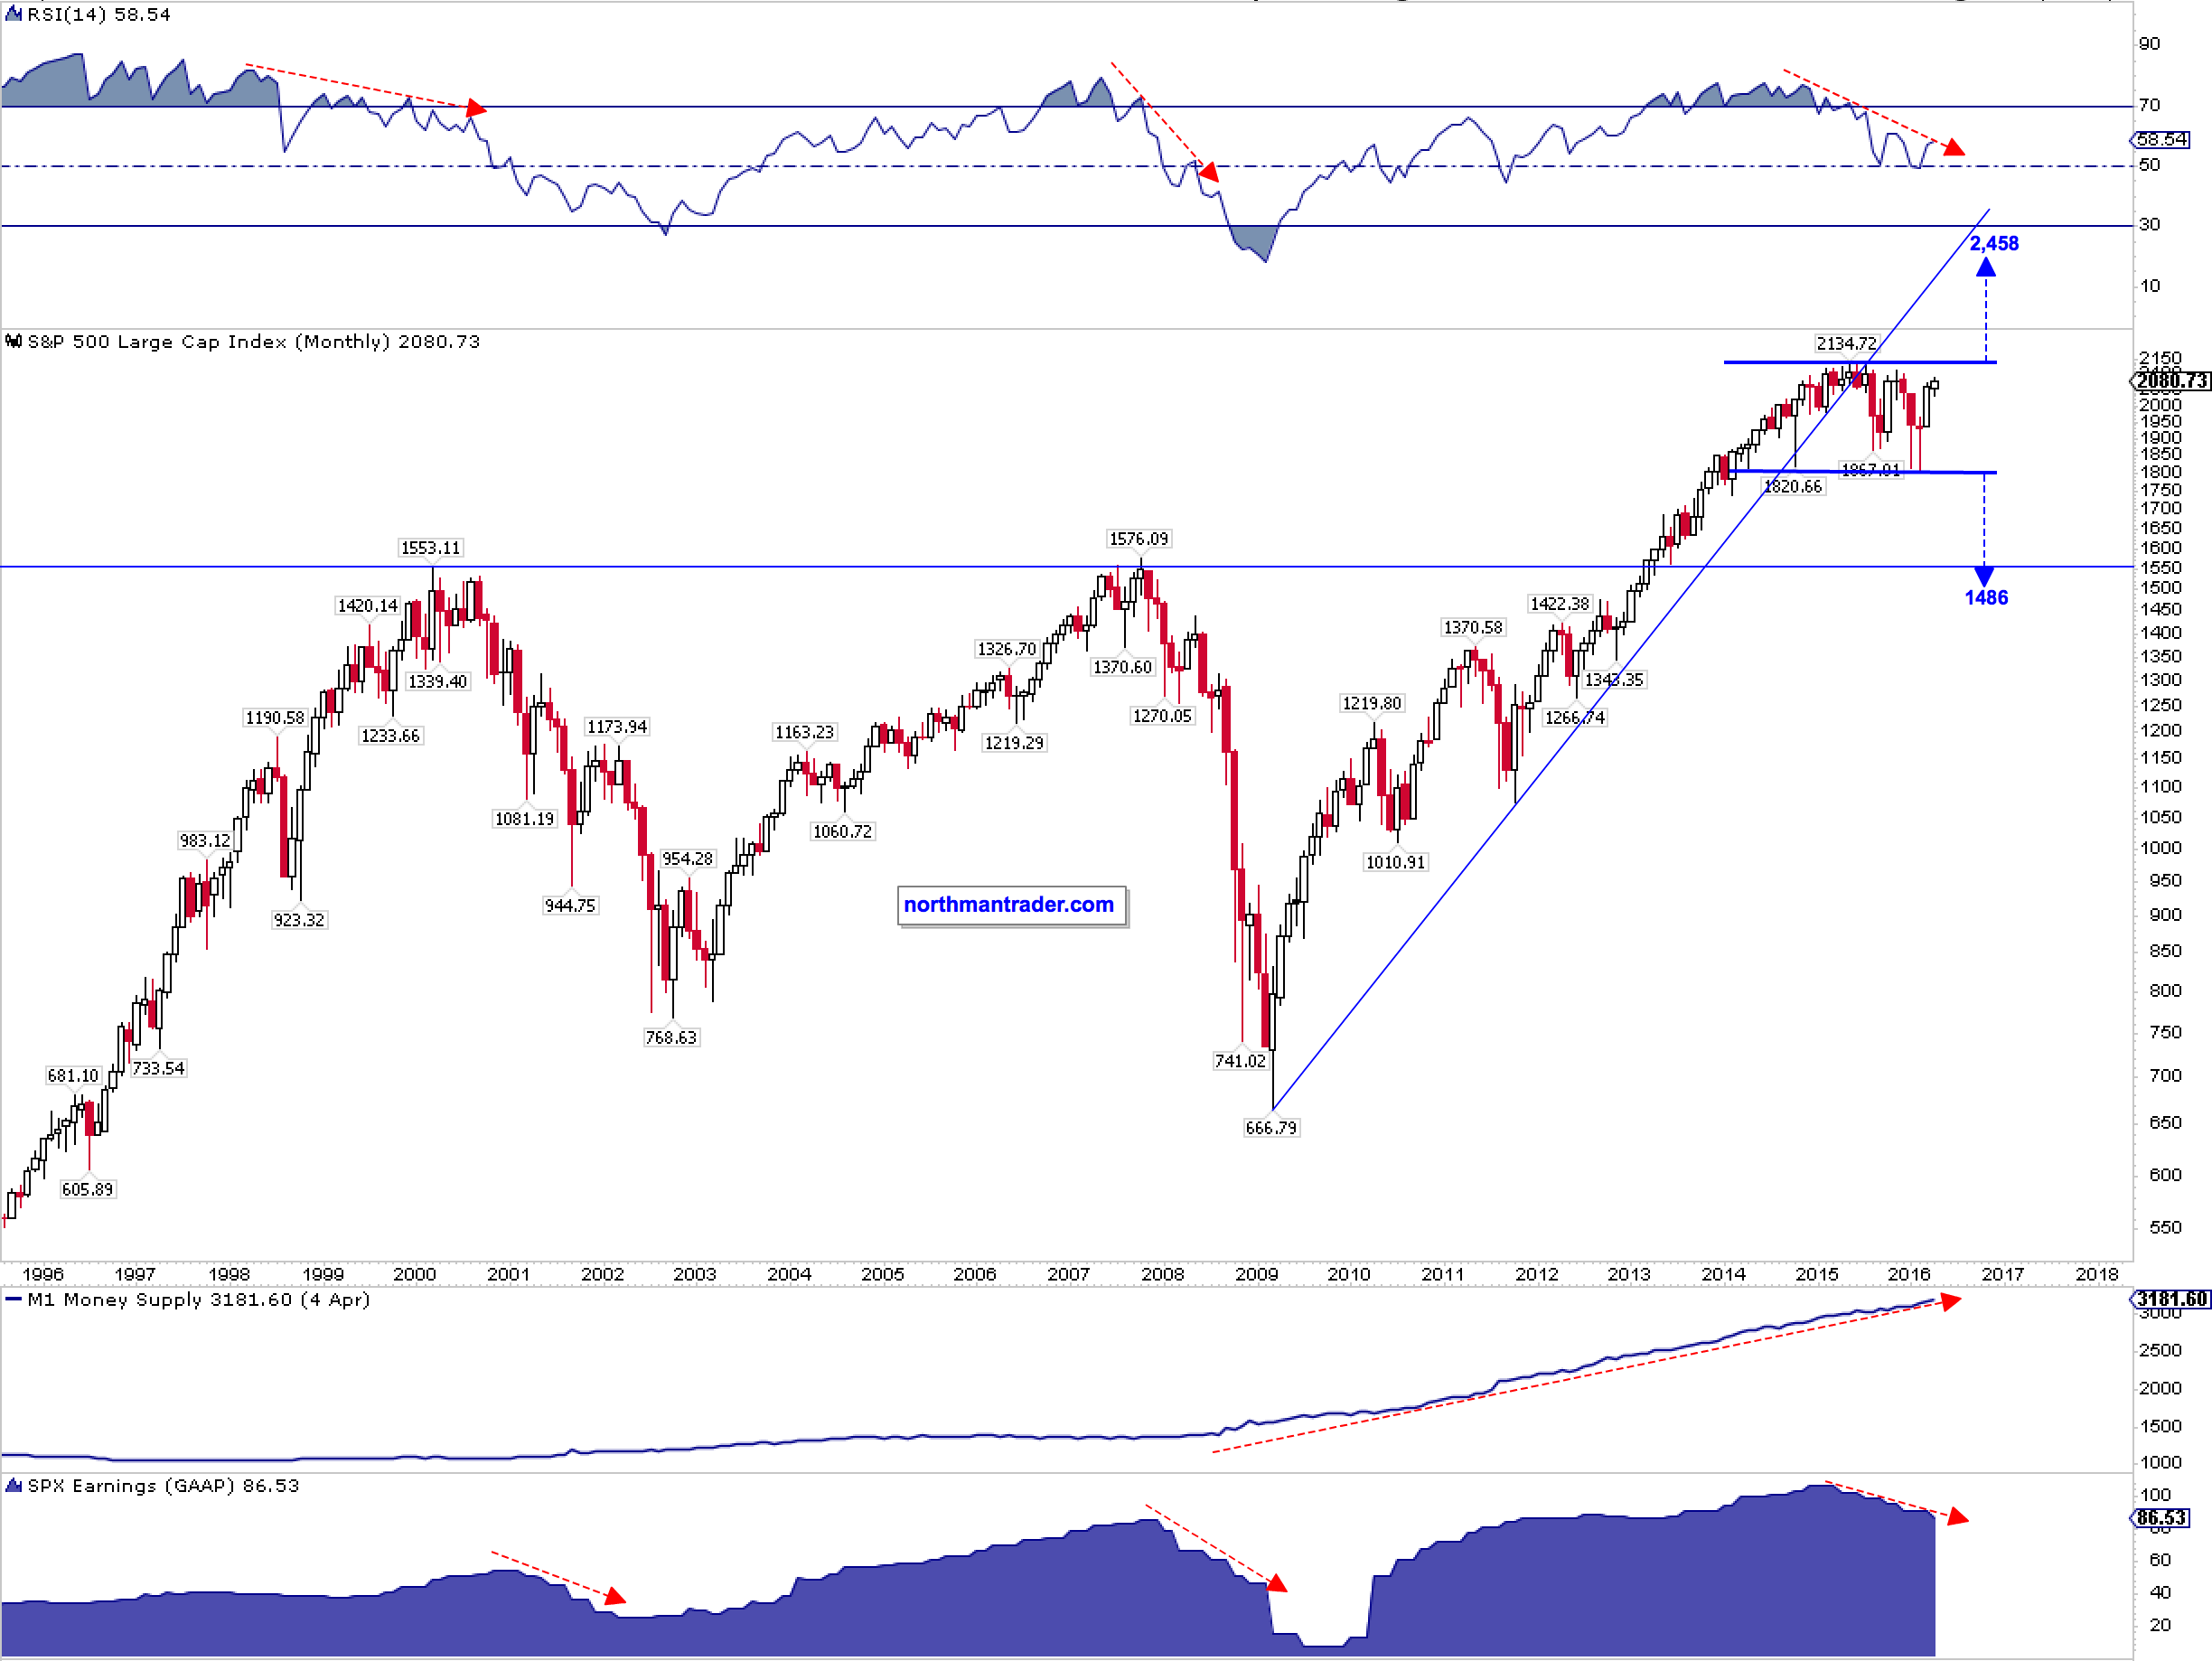
But Steen Jakobsen of Saxo Bank thinks this strength will not last. His leading indicator is a measure of the change in private sector credit growth. This peaked at the turn of the year and is now heading down sharply. Indeed the change in trend is the most negative since the financial crisis (see chart). Since this indicator leads the economy by 9-12 months, that suggests a significant economic slowdown either late this year or early  in 2018. He says that

This call for a significant slowdown coincides with several facts: the ECB’s QE programme will conclude by end-2017 and will at best be scaled down by €10 billion per

Read More, Comment and Share......

Admin

Market Complexity Could Trigger the Next Crash

Complex systems are all around us.

By one definition, a complex system is any system that features a large number of interacting components (agents, processes, etc.) whose aggregate activity is nonlinear (not derivable from the summations of the activity of individual components) and typically exhibits hierarchical self-organization under selective pressures.

In today’s infographic from Meraglim we use accumulating snow and an impending avalanche as an example of a complex system – but really, such systems can be found everywhere. Weather is another complex system, and ebb and flow of populations is another example.

Markets are Complex Systems

Just like in the avalanche example, where various factors at the top of a mountain (accumulating volumes of snow, weather, temperature, geology, gravity, etc.) make up a complex system that is difficult to predict, markets are similarly complex.

In fact, markets meet all the properties of complex systems, as outlined by scientists:

1. Diverse
Sys

Read More, Comment and Share......

Admin

Well, here it comes—September. It’s widely considered the worst month of the year for equities for good reason since it has historically seen the worst performance. Per Ryan Detrick, Senior Market Strategist, “September is the banana peel month, as some of the largest dips tend to take place during this month. Although the economy is still quite strong, this doesn’t mean some usual September volatility is out of the question—in fact, we’d be surprised it volatility didn’t pick up given how calm things have been this year.”

With the Federal Reserve, Bank of Japan, and the European Central Bank all set to announce interest rate decisions this month, and the S&P 500 Index up on a total return basis nine consecutive months as of the end of July, the stage is set for some fireworks in September.

Here’s some data to consider as September approaches:

• Since 1928, no month sports a lower average return than September, with the S&P 500 down 1.0% on average. February and May are the only other

Read More, Comment and Share......

Admin

Watch The Potential Double Tops

Doubles Tops are forming in two key ETFs, the Semiconductor SPDR (XSD) and the Consumer Discretionary SPDR (XLY), and chartists should watch these important groups for clues on broad market direction in the coming week or two. First, let's talk about the Double Top. These patterns form with two peaks near the same level and an intermittent trough that marks support. A break below support confirms the pattern and targets a move based on the height of the pattern. 

Achtung! A Double Top is just a POTENTIAL Double Top until confirmed with a break below the intermittent low. In other words, the trend is still up as long as support holds. Furthermore, Double Tops are bearish reversal patterns and trend continuations are more likely that trend reversals. 

15031405503701626567083.png

The chart above shows a potential Double Top brewing in XSD over the last three months or so. Because this is an ETF with dozens of moving parts (components), I am marking a support zone using the mid May low and the June low. A close belo

Read More, Comment and Share......

Admin
1*UPbVKnMLk9Hl84Ebbf8jFw.png?width=450

“Low volatility could be ‘the quiet before the storm,’” Nobel laureate Robert Shiller told CNBC last week, adding: “I lie awake worrying.” Over the past 20 years, the CBOE Volatility Index (VIX) has closed below 10 on only 21 days, 13 of which have been in the past two months. The current streak of 270-plus days without a 5% drawdown in any of the major U.S. indices is the longest since 1996. Meanwhile, U.S. equity values continue to diverge from earnings — Schiller’s Cyclically Adjusted PE Ratio (CAPE) has only been higher two times in market history: 1929 and 2000.

Yet, despite the many bulls claiming low volatility is historically normal, and therefore not a warning sign, evidence is beginning to mount that U.S. equity markets may be near a volatility-driven tipping point. With the market consolidated (WILTW June 29, 2017) and buoyed by the lowest interest rates in 5,000 years, investors have taken on more and riskier leverage in search of yield. Compounding the risk, much of t

Read More, Comment and Share......

Admin

How Big Oil Will Die

1*XTVXrQ5WSTrwVS6sFBi5_g.jpeg?width=550

It’s 2025, and 800,000 tons of used high strength steel is coming up for auction.

The steel made up the Keystone XL pipeline, finally completed in 2019, two years after the project launched with great fanfare after approval by the Trump administration. The pipeline was built at a cost of about $7 billion, bringing oil from the Canadian tar sands to the US, with a pit stop in the town of Baker, Montana, to pick up US crude from the Bakken formation. At its peak, it carried over 500,000 barrels a day for processing at refineries in Texas and Louisiana.

But in 2025, no one wants the oil.

The Keystone XL will go down as the world’s last great fossil fuels infrastructure project. TransCanada, the pipeline’s operator, charged about $10 per barrel for the transportation services, which means the pipeline extension earned about $5 million per day, or $1.8 billion per year. But after shutting down less than four years into its expected 40 year operational life, it never paid back its costs.

Read More, Comment and Share......

Admin

Are Investors Getting Too Bulled Up?

Ran across this post and found it interesting although anything that's only been around 7-1/2 years is truly untested but only time will tell.  All eyes are on Congress for a break in taxes for the wealthy, as well as 'stumbles' from our leader and chief, Mr. Trump.  Between the Russia investigation and foreign relations (yikes!) the tension is building, or at least being applied by the left.  Will they reach the proportions where firms hit the 'sell' button? I have to say that September is coming -  the worst month for the market thanks to Mutual Fund profit taking at end of fiscal year.  Anything is possible.  Enjoy the ride.  From LyonsShare:

Sentiment indicators can be useful tools for investors, mainly on a contrarian basis. That is, generally when readings get overly bullish, it may signal a lack of remaining buyers in the market and vulnerability to a decline in prices. Conversely, when sentiment is extremely bearish, it is often a sign that selling has been overdone and prices

Read More, Comment and Share......

Admin

The FANG Fantasy

AAEAAQAAAAAAAAofAAAAJDUwMGMzYjg1LTVkYjEtNDUxYy04YjllLWExYzIyNmIyZTk0Yg.jpg

With the “FANG” trade getting long in the tooth, so to speak, Wall Street analysts are now scrambling to formulate new acronyms to accommodate the most robust names in Big Tech today. FAANG, FAAA, FAAMG and now FANTASY have been brought forward adding companies like Microsoft, Tesla and Nvidia to the original FANG Fab-Four of Facebook, Amazon, Netflix and Google.

As market warning signs so, they don’t get better than this. Widely accepted market acronyms don’t evolve gracefully. They pop. Remember the BRICS (Brazil, Russia, India and China) and NINJA loans – (No income, no job)?

What most investors miss is that universally understood and enthusiastically embraced acronyms reflect peak sentiment. They are a market narrative boiled down to its most simplistic and easiest to grasp form. Repeated over and over and appearing everywhere, they are cognitive ease at its best. Like pieces of sea glass, all of the rough edges have been worn away over time and everyone can hold them.

In my book

Read More, Comment and Share......

Admin

Finding High Quality Companies 'Today'

We are having a hard time finding high-quality companies at attractive valuations.

For us, this is not an academic frustration. We are constantly looking for new stocks by running stock screens, endlessly reading (blogs, research, magazines, newspapers), looking at holdings of investors we respect, talking to our large network of professional investors, attending conferences, scouring through ideas published on value investor networks, and finally, looking with frustration at our large (and growing) watch list of companies we’d like to buy at a significant margin of safety. The median stock on our watch list has to decline by about 35-40% to be an attractive buy.

But maybe we’re too subjective. Instead of just asking you to take our word for it, in this letter we’ll show you a few charts that not only demonstrate our point but also show the magnitude of the stock market’s overvaluation and, more importantly, put it into historical context.

Each chart examines stock market valuation fro

Read More, Comment and Share......

Admin

A Big Move Lies Ahead

move1.jpg?w=300&h=188&width=300Past tense; that is.  A big move is coming in the S&P 500 and it will take everyone’s breath away. Simply put: The S&P 500 has traded in a multi-year consolidation range with a high of 2134 and a low of 1810. A breakout or breakdown out of this range could result in a measured technical move of the height of the range, i.e. 2134 – 1810 = 324 handles. Consequently a break toward the upside would target 2458 (15% above all time highs) and conversely a breakdown would target 1486 and represent a 30.4% correction off of all time highs.

I’ve outlined the bear arguments in detail in Feeding the Monster, so I won’t bother rehashing them here. However, in analyzing the larger market structures an interesting duality is emerging: A fight for control between the historic precedence of earnings and technicals and a very much divergent development in money supply, one of the key drivers behind stock prices since the financial crisis.

This duality can be summarized in one chart:

spx-gaap-money-supply.png?w=610&h=458&width=610

Speaking for a bre

Read More, Comment and Share......

Admin

Earnings Growth Likely Peaked In Q1

Note: The following is an excerpt from this week’s Earnings Trends report. You can access the full report that contains detailed historical actuals and estimates for the current and following periods, please click here>>>

Here are the key points:

•    The Q1 earnings is effectively over now, with results from 492 S&P 500 members already out. Total earnings for these companies are up +13.5% from the same period last year on +7.2% higher revenues, with 72.6% beating EPS estimates and 65.2% beating revenue estimates.

•    These results represent a notable improvement over what we have been seeing from the same group of companies in other recent periods. While growth reached the highest level in more than 5 years, a bigger proportion of companies have been able to beat estimates, particularly revenue estimates.

•    For the Retail sector, total Q1 earnings are up +1.7% from the same period last year on +3.1% higher revenues, with 60% beating EPS estimates and 50% beating revenue estimates.

Read More, Comment and Share......

Admin

The Big Picture

First and foremost let me point out that Ray Dalio, founder of investment firm Bridgewater Associates, has joined Twitter so I encourage you to follow him here.  Secondly I suggest you grab a cup of coffee or maybe the entire pot as he gradually lays out what he sees ahead for the market.  Enjoy!

Big picture, the near term looks good and the longer term looks scary. That is because:

  1. The economy is now at or near its best, and we see no major economic risks on the horizon for the next year or two,
  2. There are significant long-term problems (e.g., high debt and non-debt obligations, limited abilities by central banks to stimulate, etc.) that are likely to create a squeeze,
  3. Social and political conflicts are near their worst for the last number of decades, and
  4. Conflicts get worse when economies worsen.

So while we have no near-term economic worries for the economy as a whole, we worry about what these conflicts will become like when the economy has its next downturn.

The next few pages g

Read More, Comment and Share......

Admin
104264326-IMG_0346.530x298.JPG?v=1486403267&width=330

While Google and Facebook are the undisputed advertising leaders online, companies are increasingly looking for other digital ways to spend their marketing budgets, according to advertising and public relations company WPP CEO Sir Martin Sorrell.

"What our clients want and what our agencies want is more competition of the space, anything that gives more competition to the duopoly of Facebook and Google," Sorrell said to CNBC.

The two tech giants account for about 75 percent of digital ad budgets, according to Sorrell. But, there are competitors ready to chip away at their dominance, including AOL and Yahoo's ad tech platforms and Snap. Even Amazon is becoming a threat, with its ad platform recently valued at $350 billion, he pointed out.

"Getting more than two solutions is important," he said.

But while Google's issue of ads appearing next to questionable content is causing companies to pull dollars right now, Sorrell doesn't think the moves will be permanent because of how big of

Read More, Comment and Share......

Admin

rtxqye3.jpg?width=400The US pharmaceutical industry is on the brink of a new ecosystem — but it's not taking off as smoothly as expected.

Up until the past few years, biologic drugs made from living cells didn't face competition once they lost patent protection. That's been changing with the introduction of drugs called biosimilars. But their rollout hasn't exactly been the game-changing experience some had expected.

"We believe that biosimilars will capture meaningful market share, but the disappointing commercial success so far with less than $2 billion annual sales illustrates that the bar is high," Morgan Stanley analysts said in a report on Wednesday. That's in large part because of the economic challenges that biosimilars face, the report says. 

Biosimilars are a bit more complicated than your average competing medicine: Unlike generics for chemical-based drugs like antibiotics that can be interchangeable with branded versions, the copycats of biologic medications, produced using living cells, have a

Read More, Comment and Share......

Admin

Autonomous Cars And Second Order Consequences

Grab a cup of coffee, sit back and absorb this piece which I believe, will blow your mind.  I had read a good deal on self-driving cars and the implications of what lies ahead but this piece by Ben Evans has completely re-written my belief of what life will be in ten years.  Wowsa!   I know what I'll be dreaming about tonight. *lol*  Enjoy-

There are two foundational technology changes rolling through the car industry at the moment; electric and autonomy. Electric is happening right now, largely as a consequence of falling battery prices, while autonomy, or at least full autonomy, is a bit further off - perhaps 5-10 years, depending on how fast some pretty hard computer science problems get solved. Both of these will cycle into essentially the entire global stock of (today) around 1.1bn cars over a period of decades, subject to all sorts of variables, and both of them completely remake the car industry and its suppliers, as well as parts of the tech industry. 

Both electric and a

Read More, Comment and Share......

Admin

What Are The 7 Signs Of A Bear Market?

1291436?profile=originalWall Street pros say bull markets don’t die of old age. But after eight years of rising stock prices, being on the lookout for signs of a market peak makes good financial sense.

No bull lasts forever. Good times eventually are followed by bad ones, as investor euphoria gives way to fear and despair. The performance history of the Standard & Poor’s 500 stock index drives home the point: The 12 bull markets since the 1930s have all been followed by bear markets, or downturns of 20% or more, according to S&P Dow Jones Indices. The average bear market decline is a sizable 40%. Then there’s the mega-bears like the 2007-2009 rout during the financial crisis that knocked the S&P 500 down 57% and the nearly 50% slide after the internet stock bubble burst in 2000.

The current bull run, the second-longest in history and one that's generated a fourth-best gain of 254%, will eventually tire out, hit one final peak and head lower like all the rest.

The only question is when?

James Stack, a mark

Read More, Comment and Share......

Admin

Iff you're hesitant to make stock purchases at these levels, you're not alone.

Last week I updated the Warren Buffett yardstick, market cap-to-GNP. The only time it was ever higher than it is today was for a few months at the top of the dotcom mania.

However, when you look under the surface of the market-cap-weighted indexes at median valuations they are currently far more extreme than they were back then. As my friend John Hussman puts it, this is now “the most broadly overvalued moment in market history.”

Another way to look at stock prices is in relation

Read More, Comment and Share......

Admin

I found this interesting (the rise) however I have my own reservations because of the possible change in rates and inflation in 2017.  When inflation rises, interest rates also normally rise to maintain real rates within an appropriate range. PE ratios need to decline to reflect the increase in the earnings discount rate. Another way to look at it is that equities then face more competition for money from fixed income instruments. The cost of equities must therefore decline to keep or attract investors.  Then there is the Rule of 20 to consider.  Rule of 20 equals P/E + long term interest rates (average of 10 and 30 yr bond rates).  If at or below 20 minus inflation -- the market is a buy.  If above 20 minus inflation -- the market is a sell. Today we're at just about 20.  I think I'll keep my cautious side up.  Keep moving up my alerts and stick to only brief swings.  Something tells me it's going to be an interesting year.  All focus on the Fed and inflation.  

During the past week (

Read More, Comment and Share......

Admin

1291471?profile=originalRules and regulations exist to let us know what behaviors we should expect from the people we do business with. Sometimes, good sense or social convention overtake these rules — and they don’t matter so much. Just about everyone wears seat-belts these days (we all know how much they improve our odds of survival in an accident); the ranks of underage smokers have plummeted (it’s no longer cool). Once the toothpaste is out of the tube, as they say, there’s no cramming it back in.

Such is the case with the Department of Labor’s fiduciary rule. On Friday, President Trump asked the Labor Department to review the rule, which requires brokers working with retirement savers to put the interest of their clients ahead of their own. After years of work on it, the regulation was finalized last year by the Obama administration.

Read More, Comment and Share......

RSS
Email me when there are new items in this category –

We welcome you to post a blog entry, oped or share your daily reading with us as long as it is relevant to the topic of investing and not an attempt to sell a product, proprietary strategy, platform or other service. Please provide links to any research data and if re-posting other articles, give credit where credit is due providing a back link to the original site.

300 words minimum per post. You may also sort by category or search by topic. Don't forget to comment and please "share" via Facebook, Twitter and Google+. If you have any questions, please contact us.

FOLLOW STOCKBUZ

__________________

This is a member-supported site. Please donate when you can to help pay the rent. Thank you!

Stay Informed. Sign up for the FREE StockBuz eNewsletter

________________

Investing involves substantial risk. All content is subject to StockBuz disclaimer.

Create Income With Option Spreads

All content on StockBuz.net is subject to disclaimer and Terms of Service