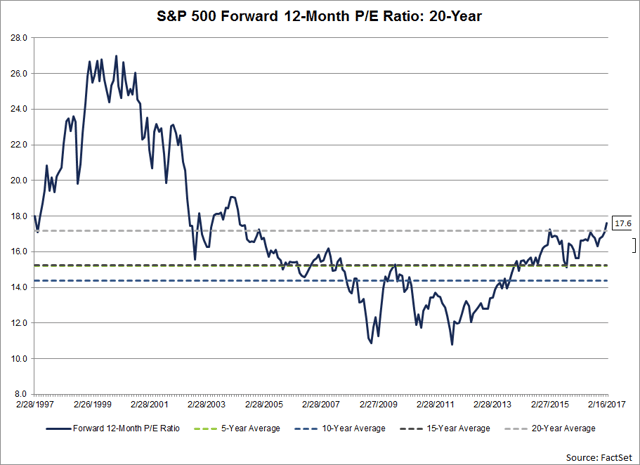
I found this interesting (the rise) however I have my own reservations because of the possible change in rates and inflation in 2017. When inflation rises, interest rates also normally rise to maintain real rates within an appropriate range. PE ratios need to decline to reflect the increase in the earnings discount rate. Another way to look at it is that equities then face more competition for money from fixed income instruments. The cost of equities must therefore decline to keep or attract investors. Then there is the Rule of 20 to consider.
During the past week (on February 15), the value of the S&P 500 closed at yet another all-time high at 2349.25. As of today, the forward 12-month P/E ratio for the S&P 500 stands at 17.6, based on yesterday’s closing price (2347.22) and forward 12-month EPS estimate ($133.49). Given the high values driving the “P” in the P/E ratio, how does this 17.6 P/E ratio compare to historical averages? What is driving the increase in the P/E ratio?

The current forward 12-month P/E ratio of 17.6 is now above the four most recent historical averages: five-year (15.2), 10-year (14.4), 15-year (15.2), and 20-year (17.2).
In fact, this week marked the first time the forward 12-month P/E has been equal to (or above) 17.6 since June 23, 2004. On that date, the closing price of the S&P 500 was 1144.06 and the forward 12-month EPS estimate was $65.14.
The Drivers of Change
Back on December 31, 2016, the forward 12-month P/E ratio was 16.9. Since this date, the price of the S&P 500 has increased by 4.8% (to 2349.45 from 2238.83), while the forward 12-month EPS estimate has increased by 0.5% (to $133.49 from $132.84). Thus, the increase in the “P” has been the main driver of the increase in the P/E ratio to 17.6 today from 16.9 at the start of the first quarter.
It is interesting to note that analysts are projecting record-level EPS for the S&P 500 for Q2 2017 through Q4 2017. If not, the forward 12-month P/E ratio would be even higher than 17.6.
Courtesy of Factset


Comments