
1. The Worst of Times: In hindsight, it was never going to end well when both stocks AND bonds were trading at crazy expensive levels. It is the worse case scenario for traditional passive buy and hold portfolios.

Source: Dr. Timo Teuber
2. Max Pain: Passive buy and hold + stocks and bonds down = portfolio pain. And it is showing up clearly in Google Trends data on searches for "why is 401k down".
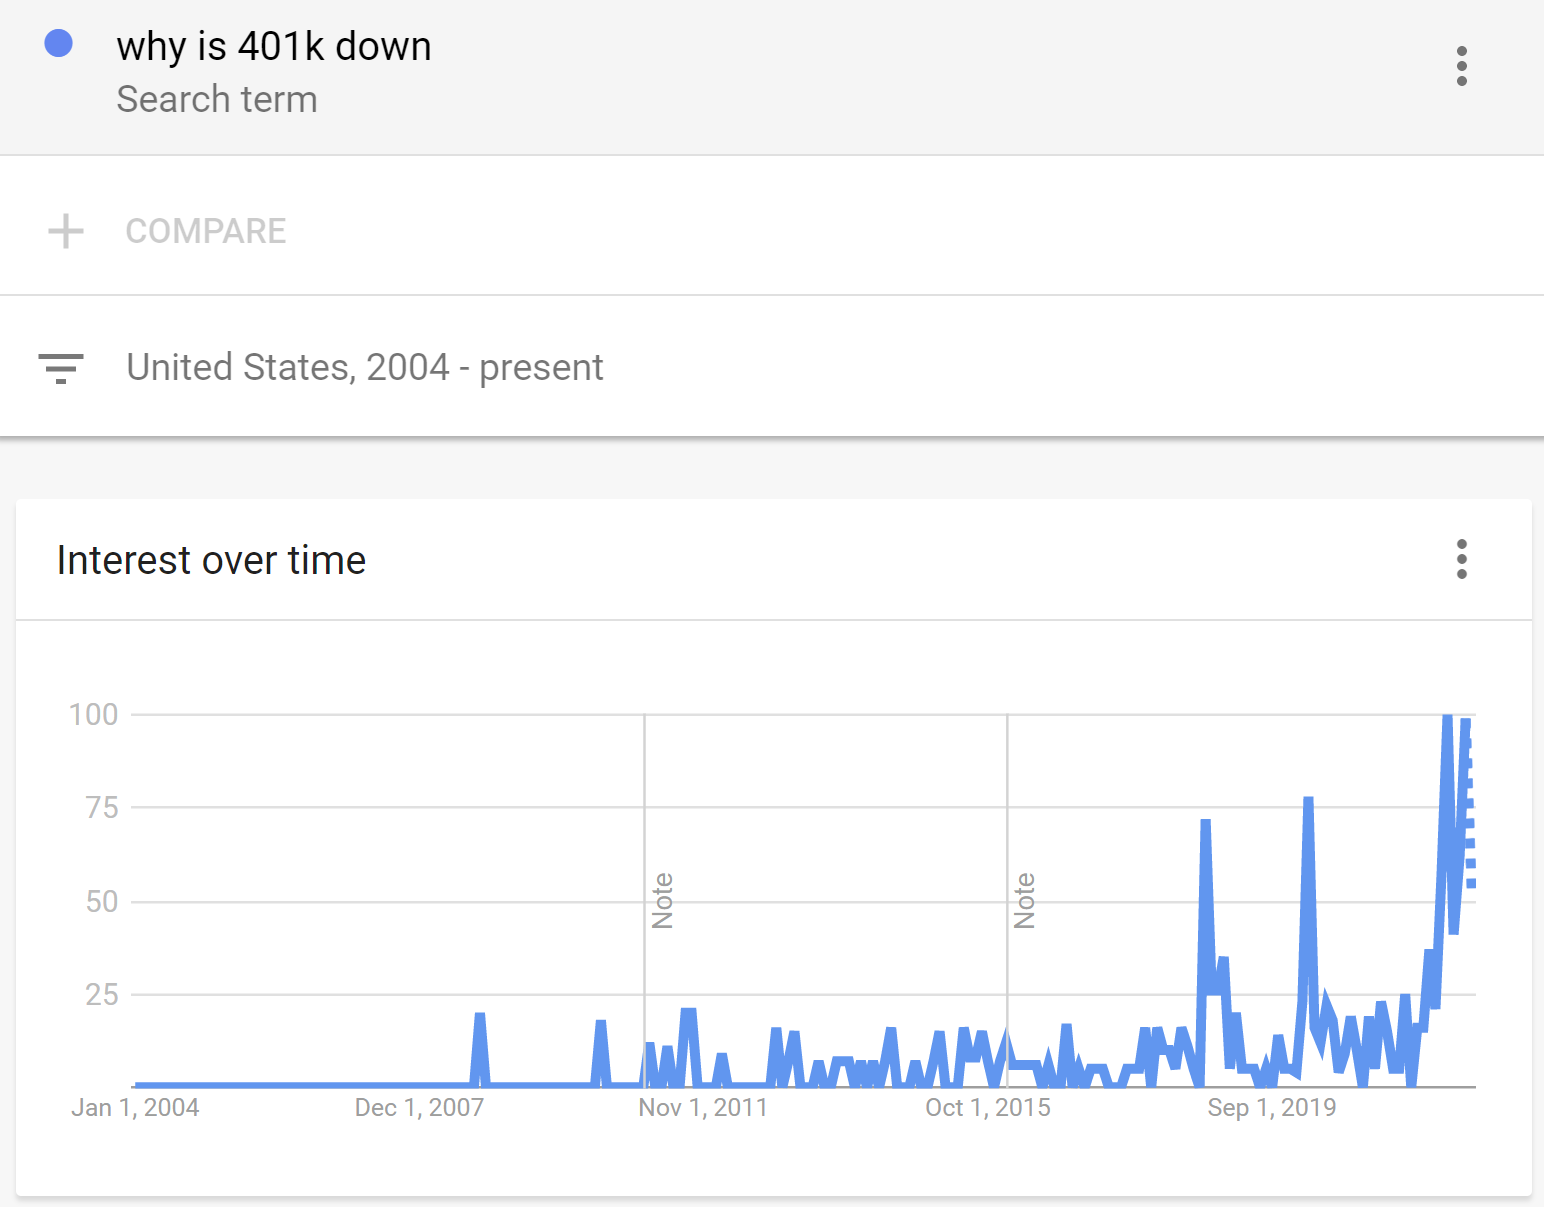
Source: @Callum_Thomas Google Trends
3. Extreme Valuation Swinging: We’ve just witnessed an extremely rapid and substantial contraction in P/E multiples (which follows a previous extremely rapid and substantial expansion!). The question many will ask: "is it cheap yet?"

Source: @keyeventrisk
4. Is it Cheap Yet? In terms of levels, even though the US PE10 ratio has come down sharply, it is still some way off the bottoms seen in 2016/18/20. So I would say no, it is not cheap yet: not expensive anymore, but not cheap.
Even the rest of world is still not far off the top of the range of recent history (albeit cheaper than US and cheap by longer-term historical standards).

Source: Chart of the Week - Not Expensive, But Not Cheap Yet
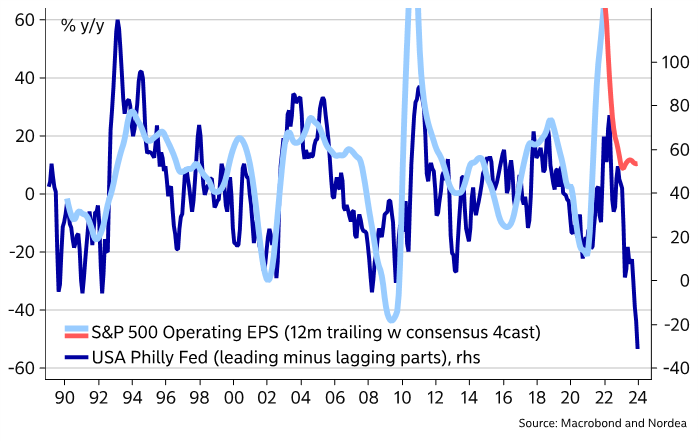
5. Earnings @ Risk: The problem with lower P/E ratios is that while the P has moved, the E is on thin ice -- and the cracks are starting to show...
Source: @MikaelSarwe
6. Downgrade Doom Due: Once analysts cotton-on to the steadily deteriorating macro outlook, we should expect to see waves of earnings downgrades.
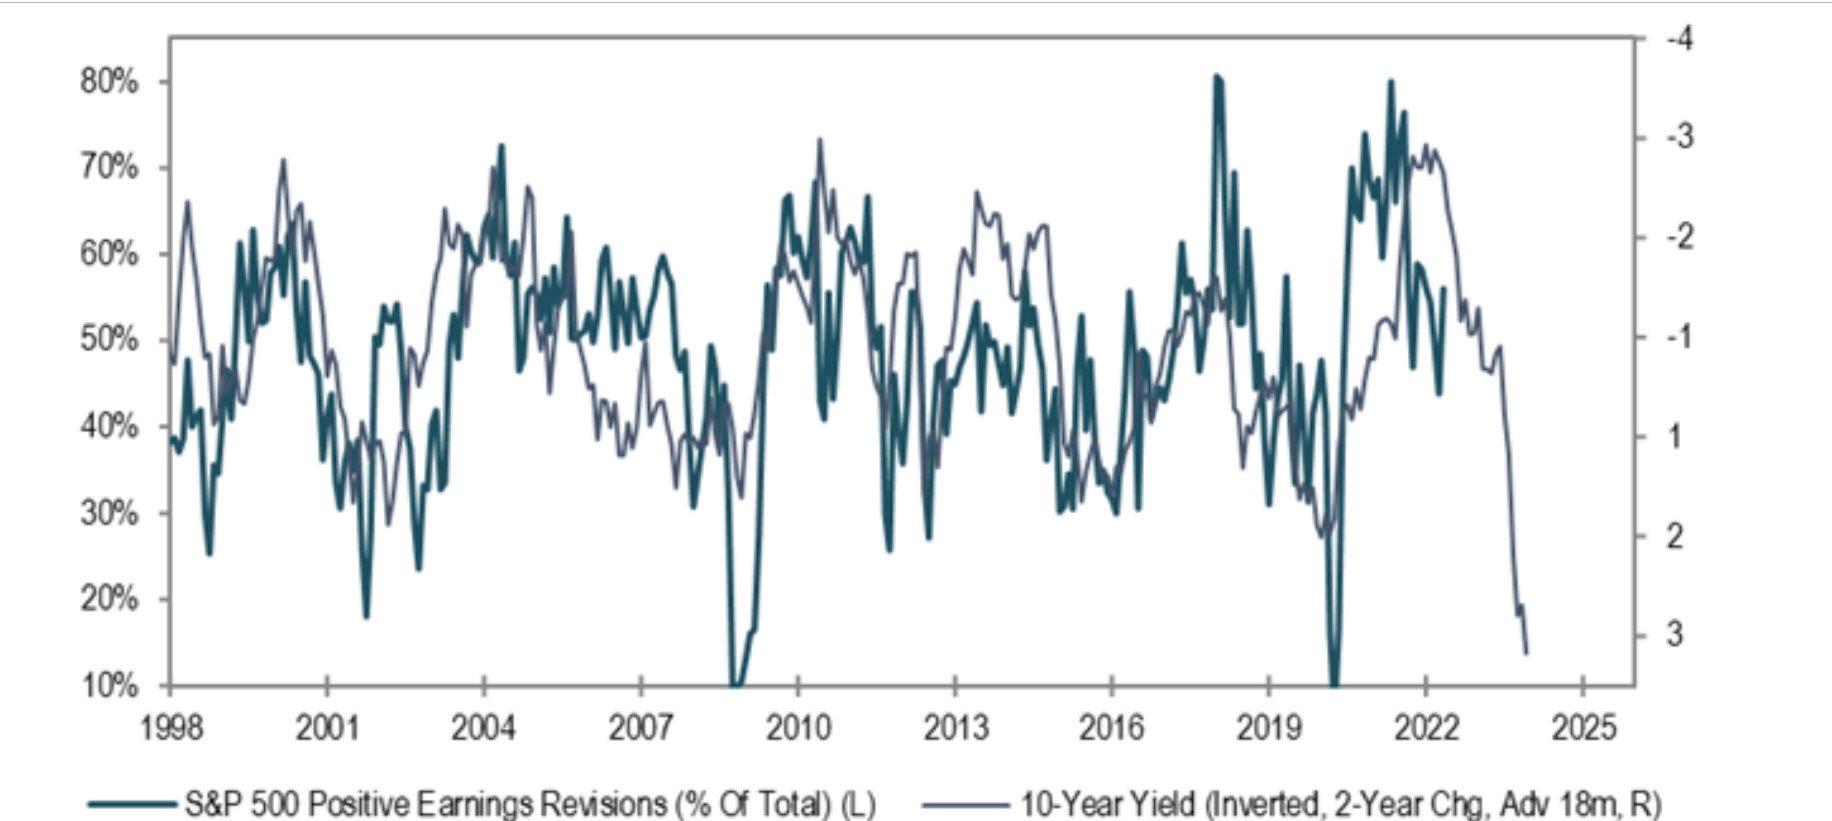
Source: @MichaelKantro
7. Price vs Earnings: Interestingly, for now at least the market appears to be front-running the destined downgrade doom...
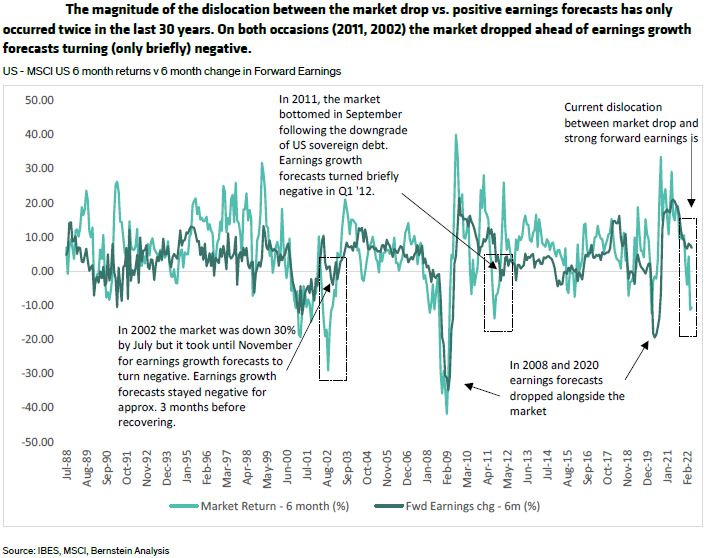
Source: @BernsteinBuzz
8. Tech Ex-Growth: Sales stagnation suggests more multiple contraction coming.
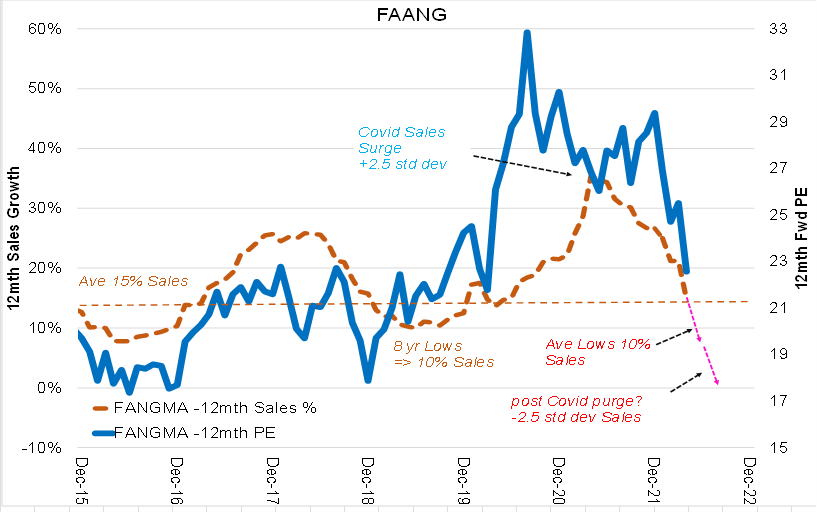
Source: @EquitOrr
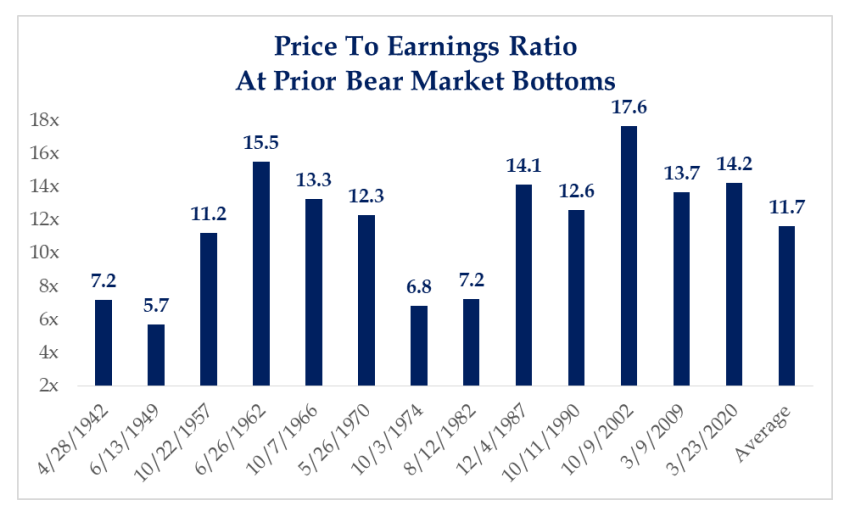
9. Bear Bottoms: And another thing... on average, the trailing P/E ratio trades at 11.7x when a bear market bottoms (with a historical max/min of 5.7x-17.6x). The current trailing P/E for the S&P is about 18.5x — so could be some ways to go yet.
Although again, n.b. the "E" is a moving target!
Source: @strategasasset
10. Consumer Sentience: Lastly, while the correlation is not perfect, here’s yet another chart pointing to P/E pressure.
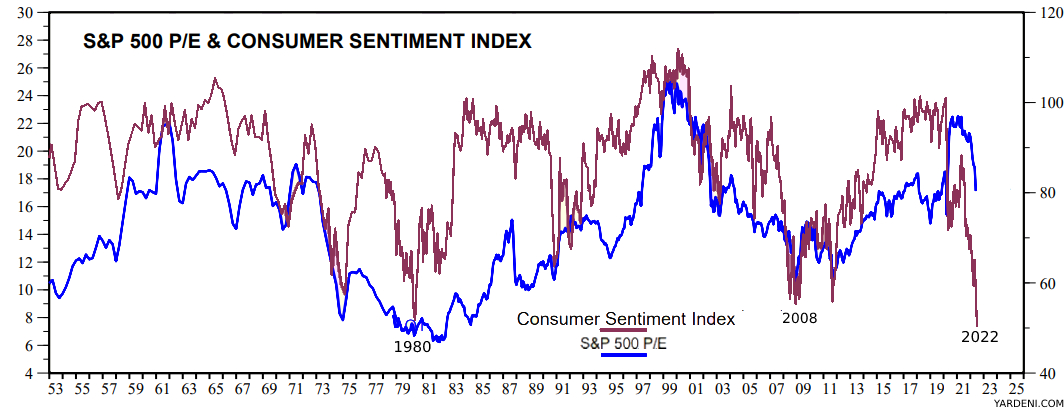
Source: @MFHoz
Thanks for following, I appreciate your interest!
BONUS CHART >> got to include a goody for the goodies who subscribed.
“Official Bear Market“: you probably had the misfortune of reading or hearing this week something along the lines of the S&P500 “officially“ going into a bear market, given that a -20% drawdown from the all-time high was finally chalked up.
I would remind or suggest that “bear markets“ are a process, not a percent change.
Serious market analysts wouldn’t bother with some arbitrary % change as a means of understanding the lay of the land in terms of risk vs opportunity. Or as a short-cut to understanding the macro backdrop and outlook, valuation picture, monetary tides, the prevailing trends (or lack thereof), gyrations and vagaries of investor sentiment and positioning, and so on and such forth.
It is a simplifying trick to make writing mass-market financial media content easier, and an attempt to making an extremely complex and dynamic thing simple. To quote/paraphrase Einstein, we should seek to “make everything as simple as possible, but no simpler.” And this one probably does fall into the latter part of that statement.
Having said all that, I did notice an interesting chart in my files as I was writing-up some reports last week: using this oversimplifying rule of “down -20% = bear market“ — this chart tracks the percentage of countries (70 different country stockmarket indexes in this case) whomst are in an “official bear market“.

At 26% it is just above the peak of 23% during the 2018 rates-quake, but far behind the levels seen at what we would call proper bear markets (i.e. early 2000’s and 2008 — I still call 2020 a crash: not a bear market… the distinction in that respect is with the 2000 bear market you had time to adjust if you were caught offside, 2020 you were either right or wrong and could only react after the fact).
So there’s a lot we could say about this chart, for instance, those spikes in global bear markets were basically a buying signal — outside of genuine global equity bear markets…
Again, bear markets are a process not a percent change: bear markets happen because monetary support is being withdrawn, because the business cycle is into recession and earnings fall, because valuations were too high to begin with, and/or something gets fundamentally broken …bear markets are a reflection of business and financial cycles.
So aside from looking at the technicals and sentiment, and the news flow, etc… to really understand the cyclical risk/return outlook requires digging into the full picture in all its complex glory. That’s why market timing is hard: and therein lies the appeal of oversimplification.
We need to simplify to avoid fooling ourselves or getting confused, but we can’t simplify it too far lest we lose the signal for the noise.
Courtesy of Callum Thomas

Comments